Categories – Main Page
Introduction
Welcome to Bigpos support.
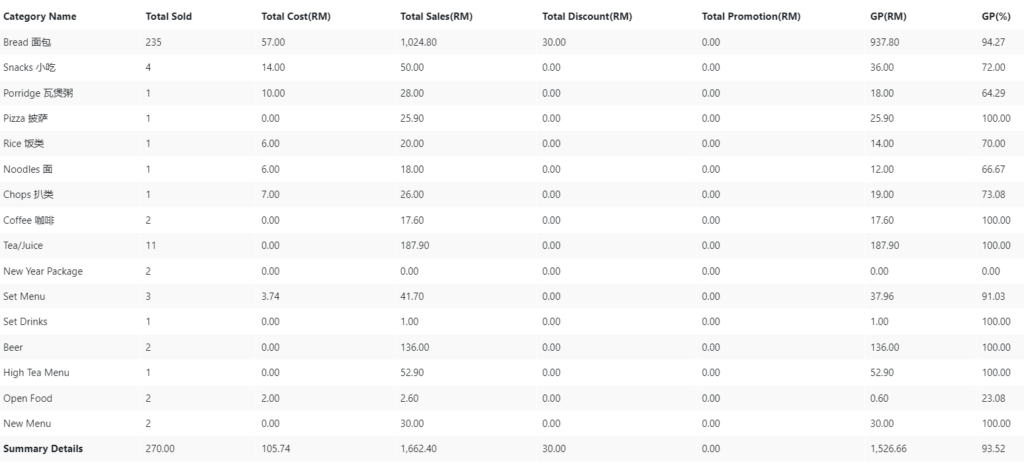
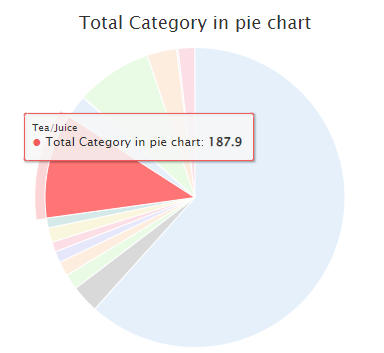
Categories report shows specifically product categories sold by providing total category of sales in a pie chart including. The page will also show you the listing of Category Name, Total Sold, Total Cost, Total Sales, Total Discount, Total Promotion, GP(Gross Profit)amount and GP percentage.
How to view Categories Report?
To view Categories Report, follow the following steps:
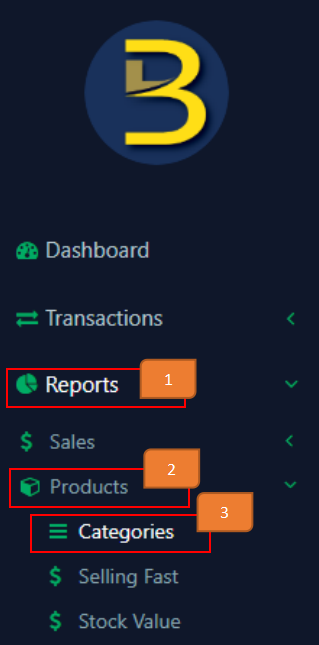
- Click ‘Reports’ on the left side panel.
- Click ‘Product’ from the dropdown menu.
- Click ‘Categories’.
How to generate Categories Report?
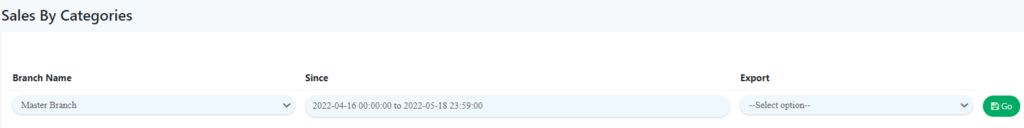
To start generate report of product sold by Categories for each branch, follow the following steps:
- Select Branch Name
- Select Date Range to be inspected
- Click ‘Go’
Note: If you want to export records, select the format to be exported (CSV or PDF). If not, leave it as ‘–Select Option–’ by default.
Example of Categories Report:
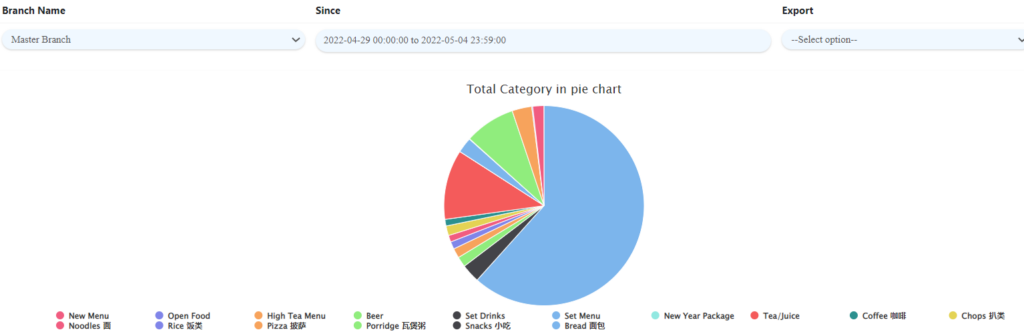
How to download the ‘Pie Chart’?
- Click on the icon as shown below on the upper right side of the pie chart and select which format you want to download.

User can also ‘View it in full screen‘ or ‘Print chart‘.
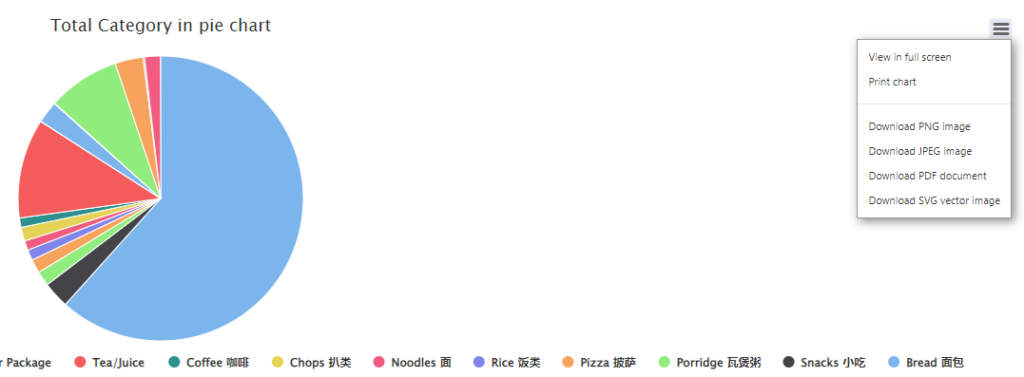
There are few format options to choose namely PNG image, JPEG image, PDF document and SVG vector image.