BIG Analytics User Manual
Introduction
Welcome to BiG Analytics, a powerful business analytics application developed by Synergy Alliance Solutions Sdn Bhd. This app is specifically designed to empower businesses by providing real-time insights into critical operational data, enabling users to make informed decisions with ease. Whether you are tracking sales growth, monitoring employee activities, or evaluating product performance, BiG Analytics simplifies the process with a user-friendly interface that is accessible anytime and anywhere. It supports multi-account management, real-time performance tracking, and customer behaviour analysis, making it an essential tool for businesses aiming to optimize workflows and drive growth. This user manual will guide you step-by-step through the app’s features, installation process, and best practices to help you unlock its full potential.
Installation Guide
Android
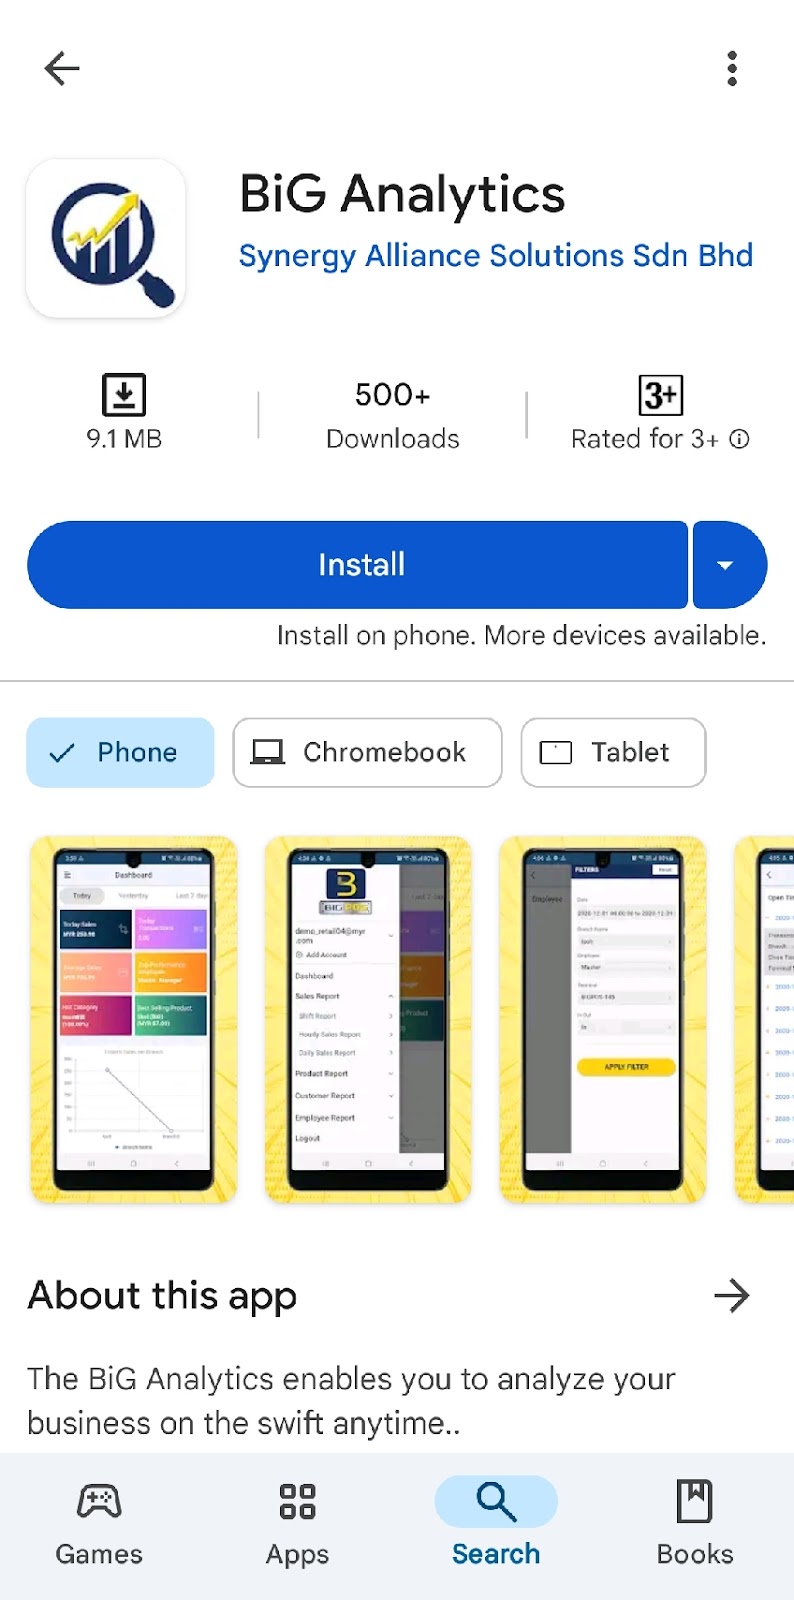
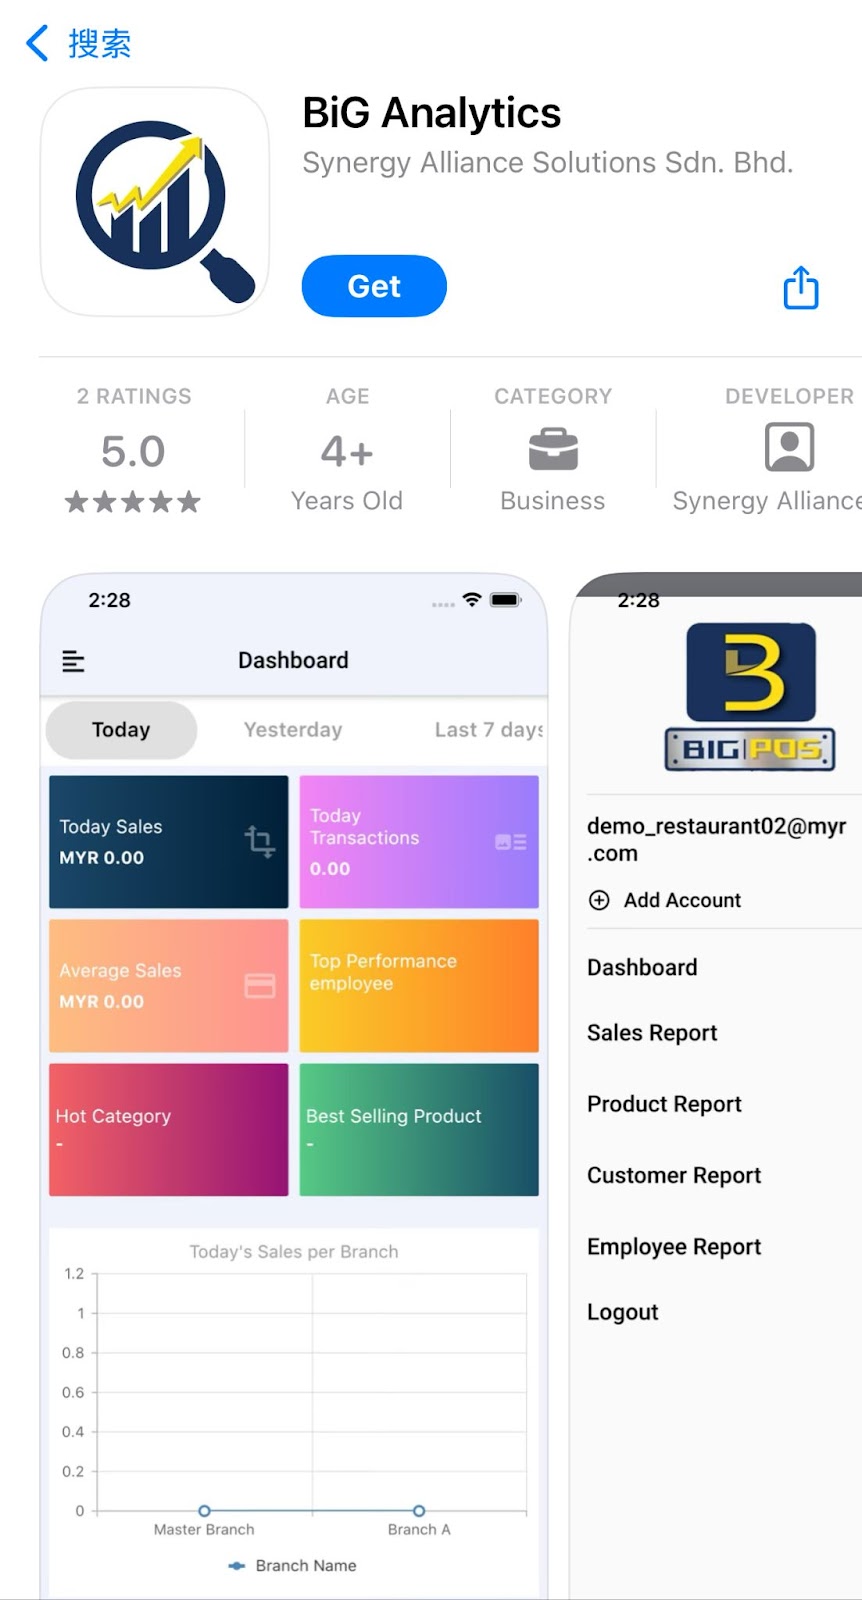
Search ‘BiG Analytics’ in the Google Play Store or your device app store. The app can be downloaded for free and has a size of about 9.1 MB. The required OS version for this application is Android 5.0 and above.
iOS
Search ‘BiG Analytics’ in the Apple App Store. The app can be downloaded for free and has a size of about 25 MB. The required OS version for this application is iOS 11.0 and above.
User Login
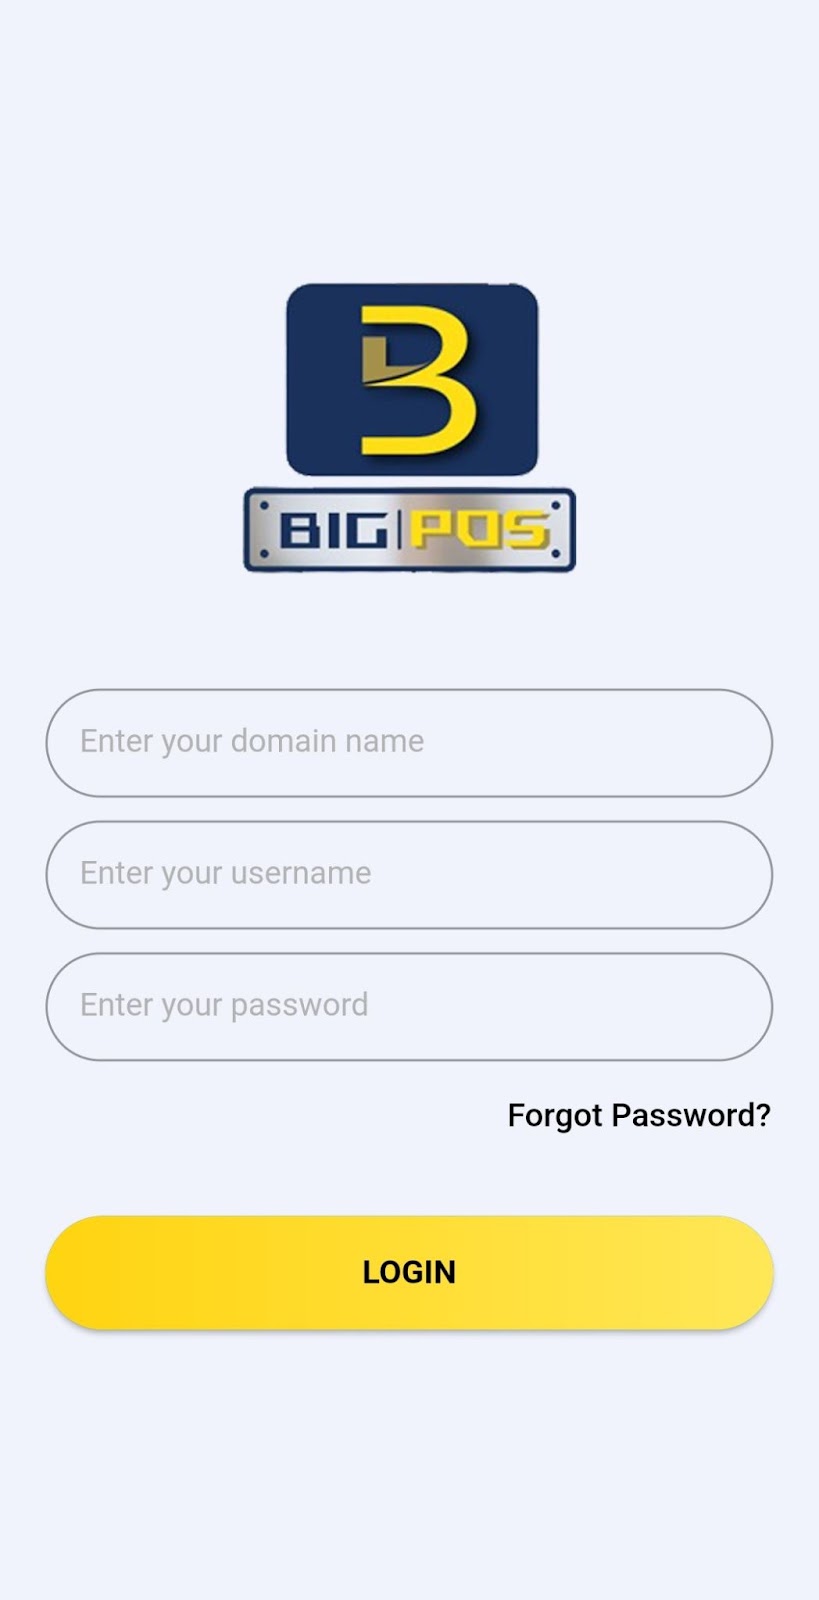
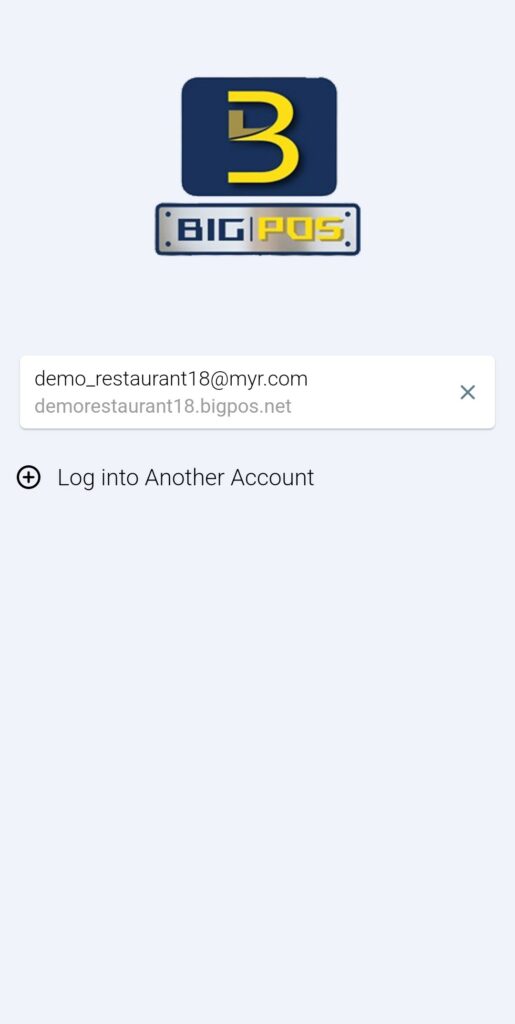
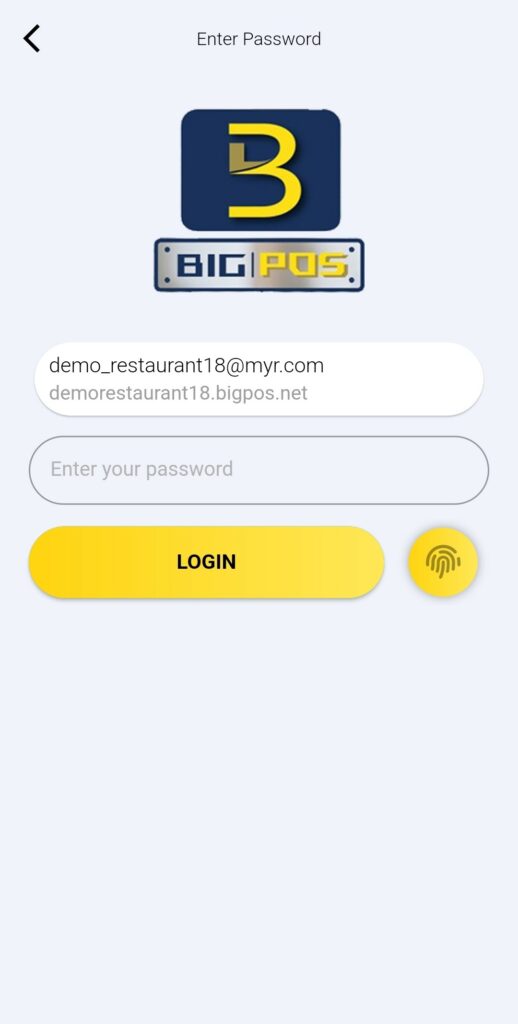
After the installation is done, the first-time user will be directed to the login page. Before logging into BiG Analytics, a valid user account must registered for BiGPOS Pro or BiGPOS Lite. The login page requires the assigned domain name, registered username and password to enter the application. After entering all the valid credentials, click on the![]() button.
button.
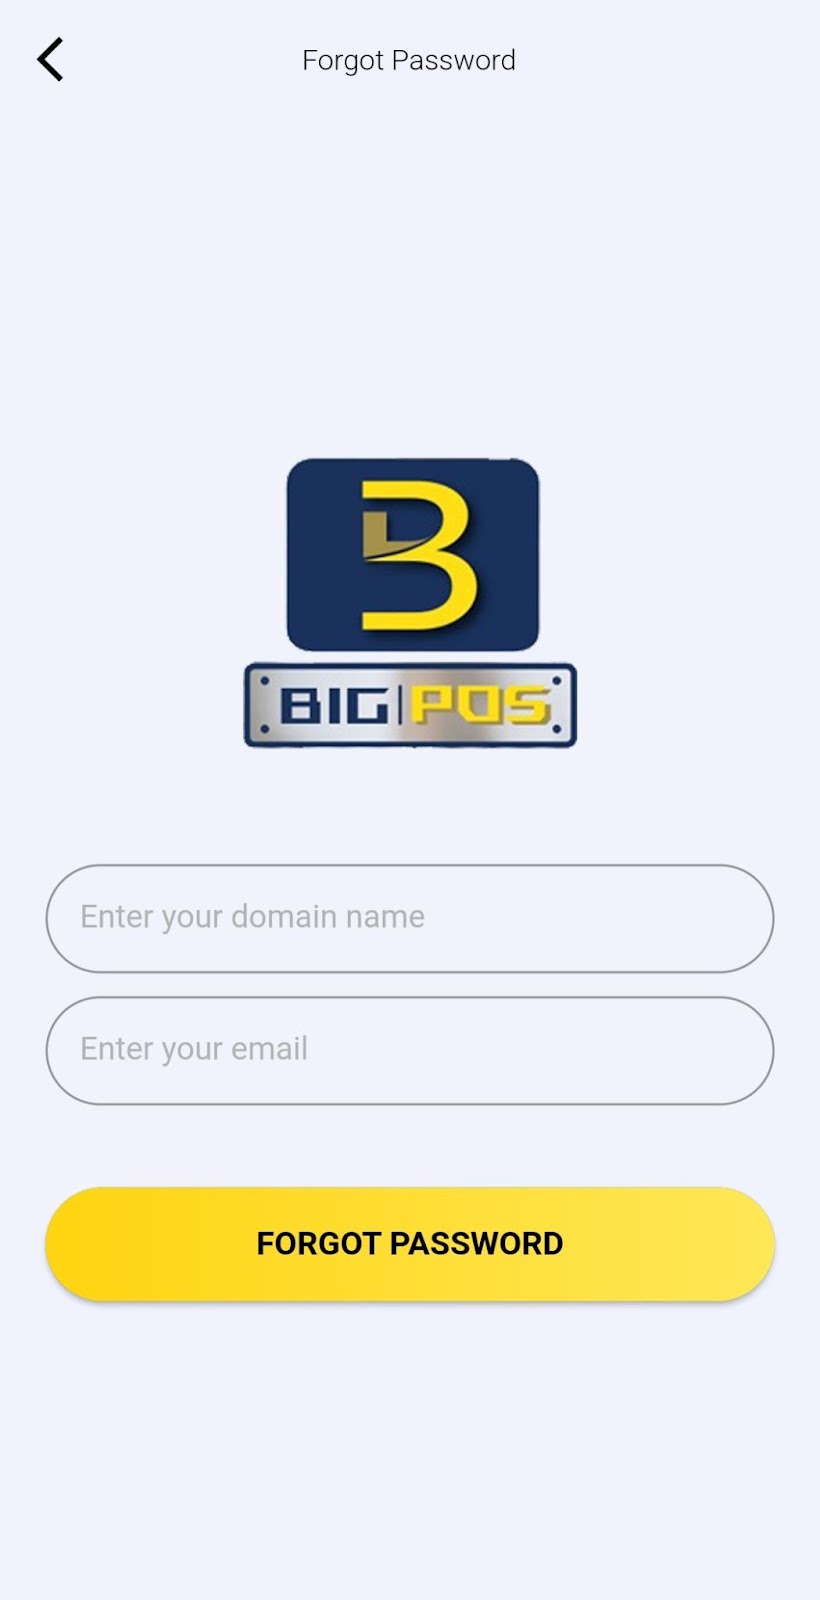
By clicking ![]() on the login page, you will be directed to the forgot password page. You’ll need to enter your domain name and registered email to receive the reset password email.
on the login page, you will be directed to the forgot password page. You’ll need to enter your domain name and registered email to receive the reset password email.
Dashboard
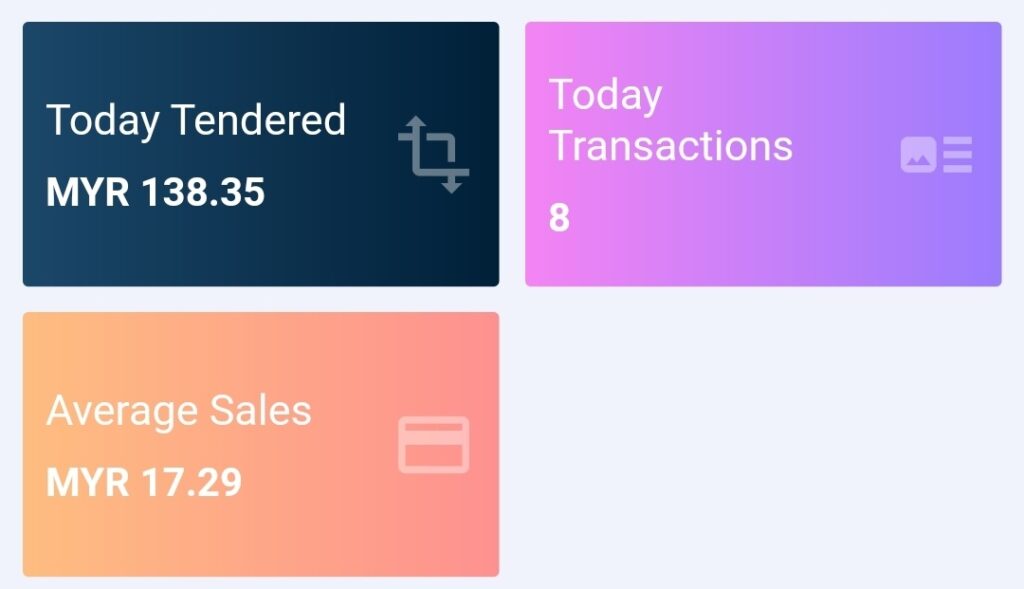
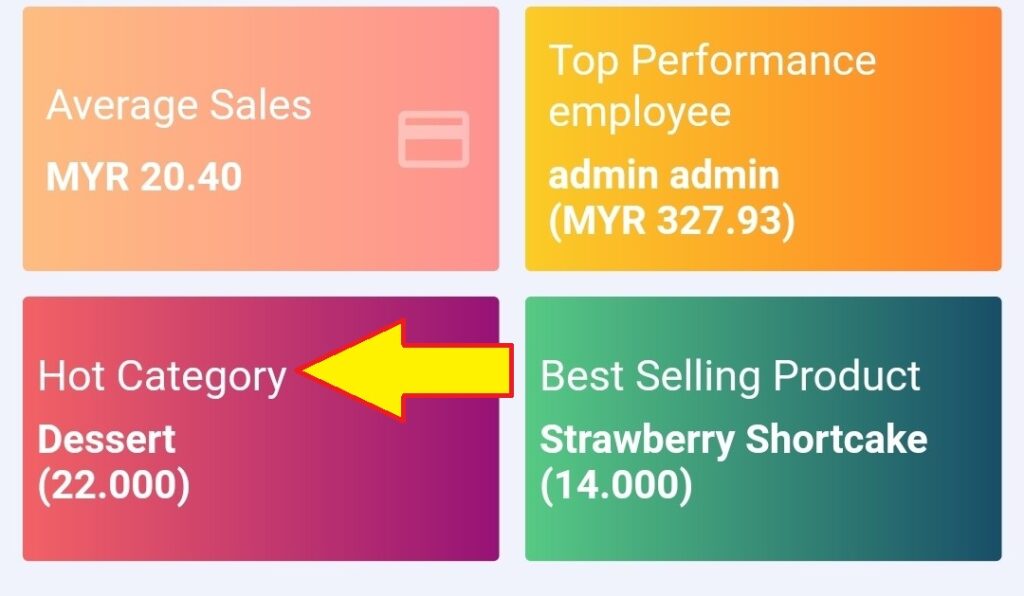
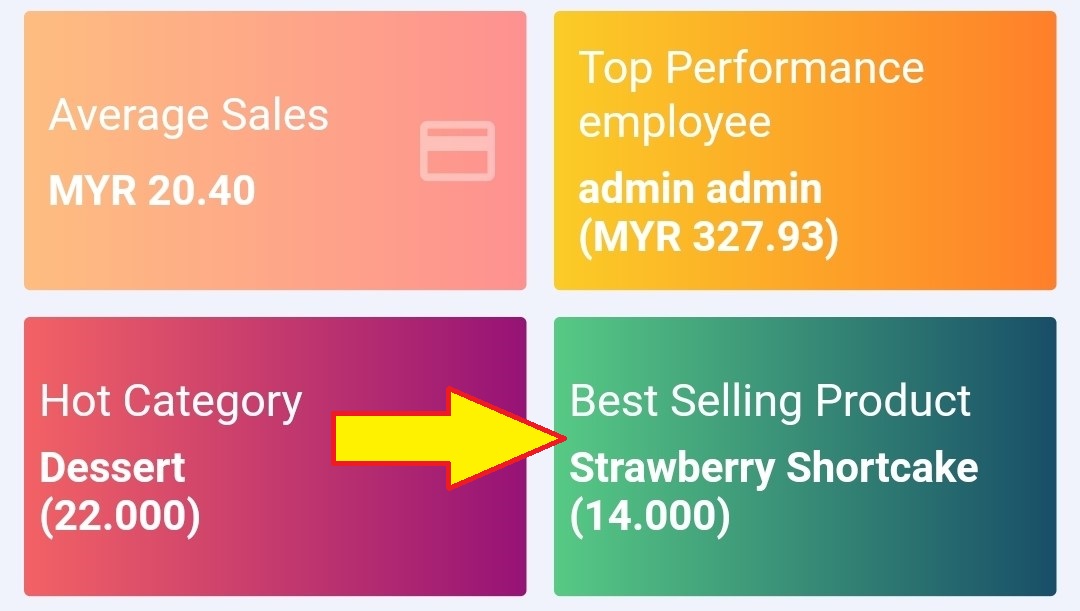
The dashboard can display the overview of the business performance to the user including the tendered cash, transactions, average sales, top-performance employees, the hot category as well as the best-selling product.
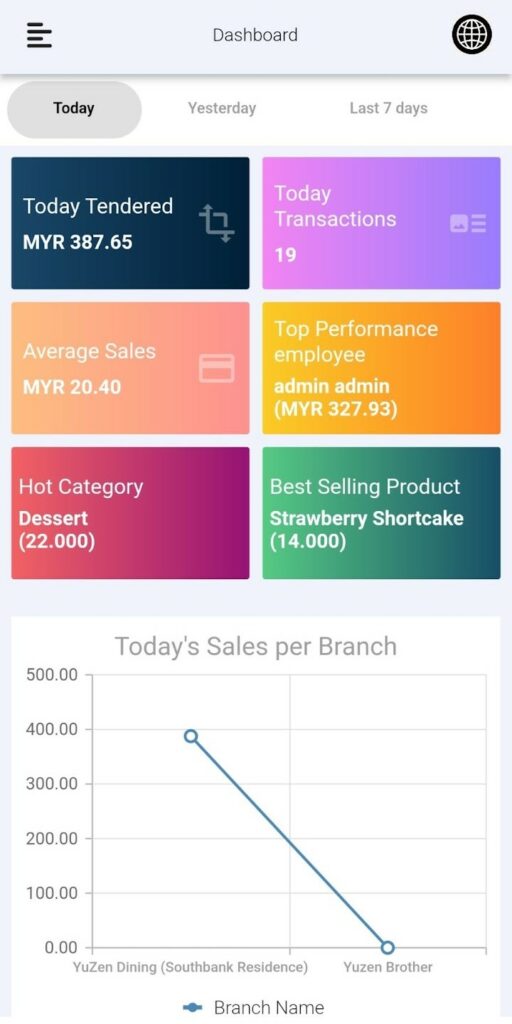
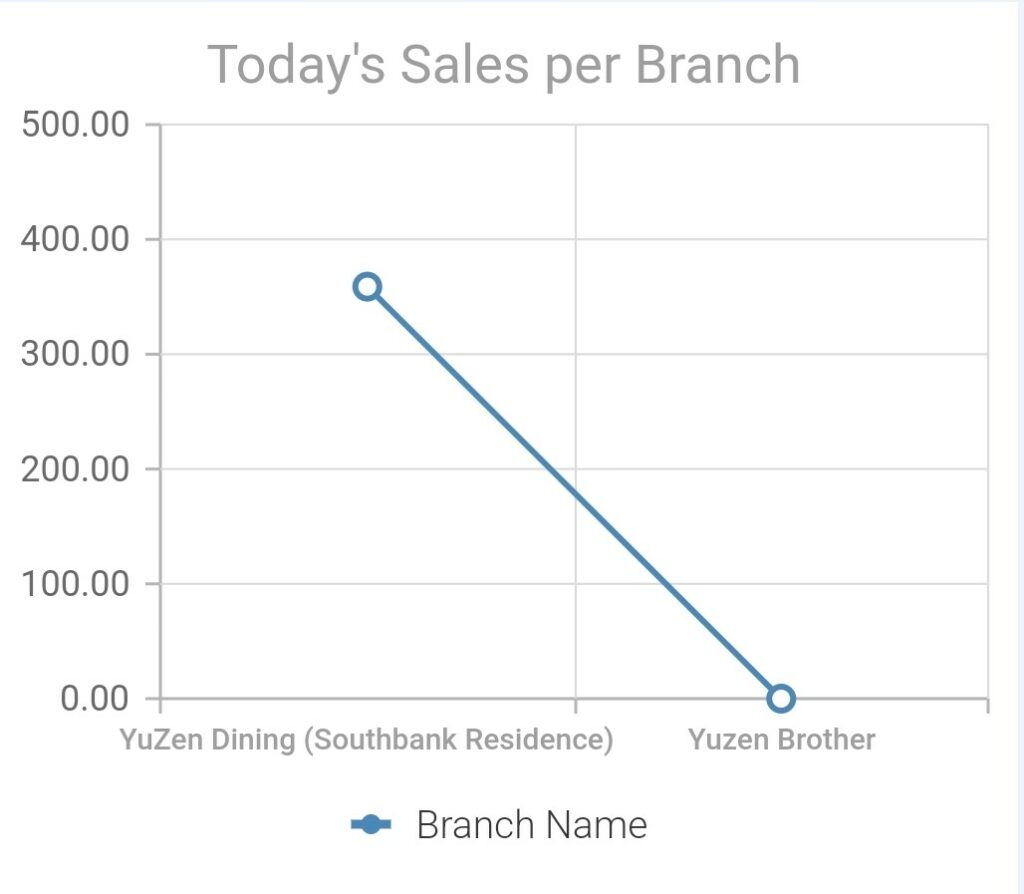
In the dashboard, two graphs are plotted to indicate the performance of the business. The first graph is the sales per branch where each branch’s sales are plotted so the performance of each branch can be viewed visually.
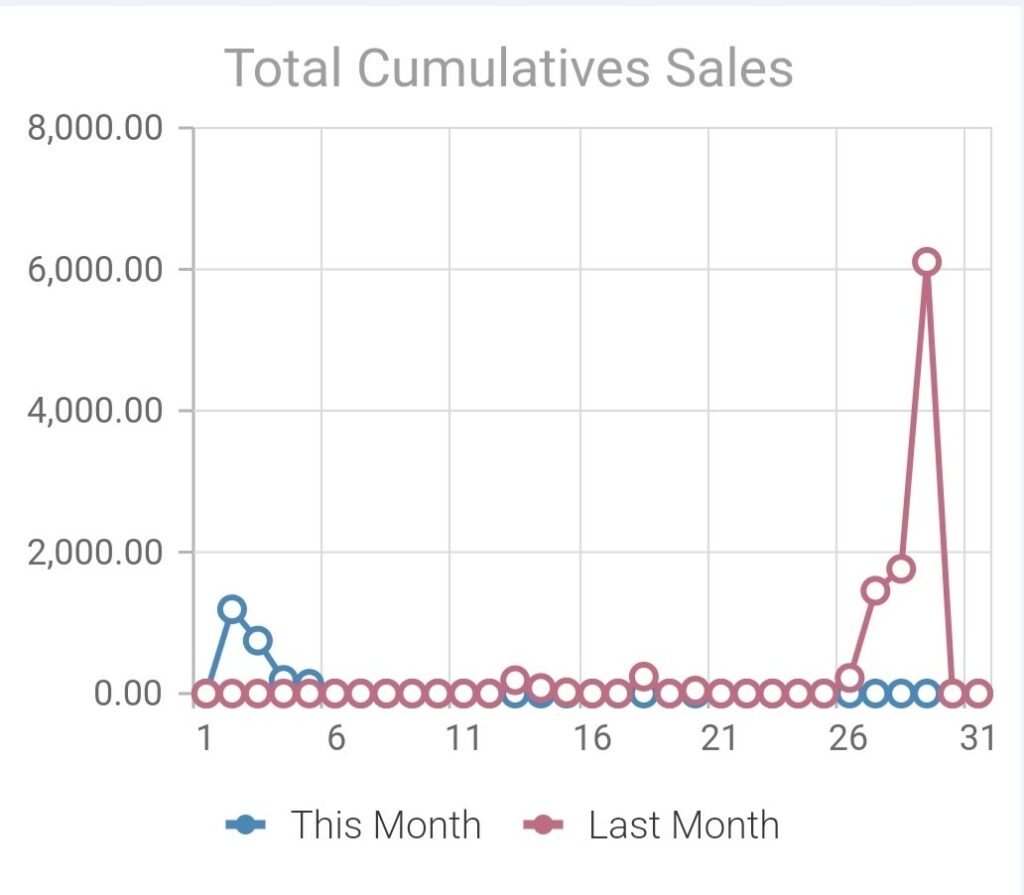
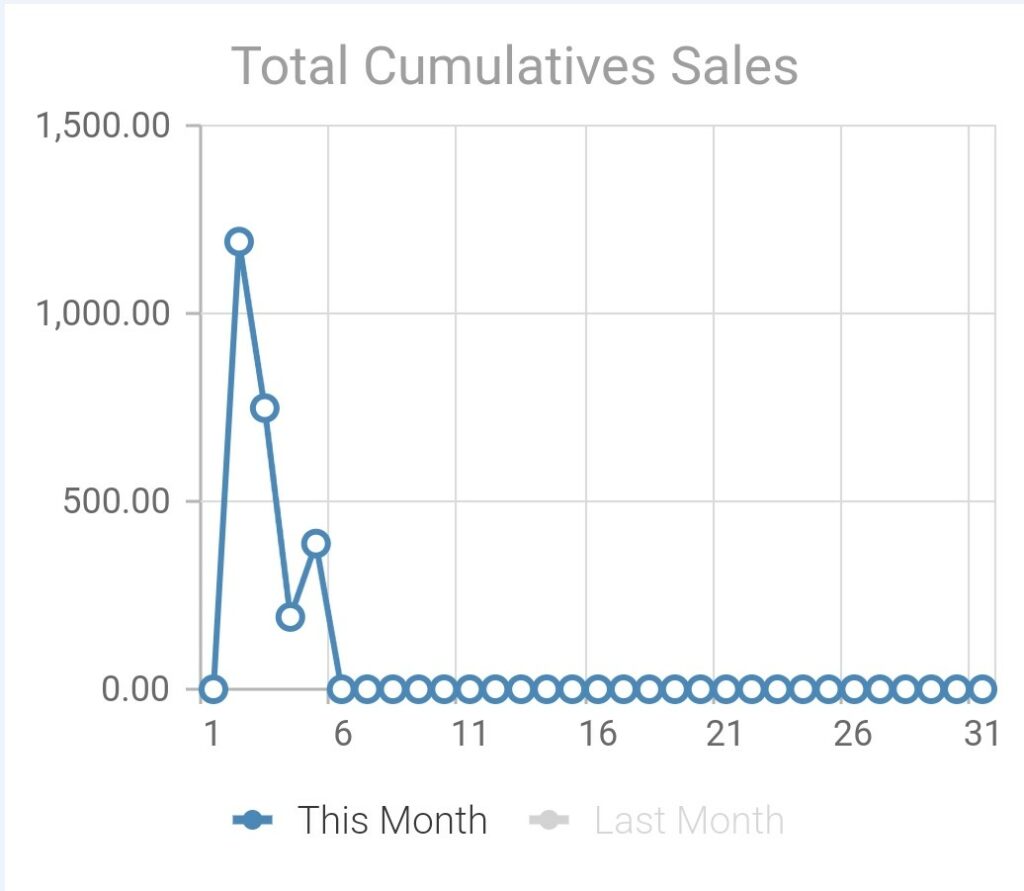
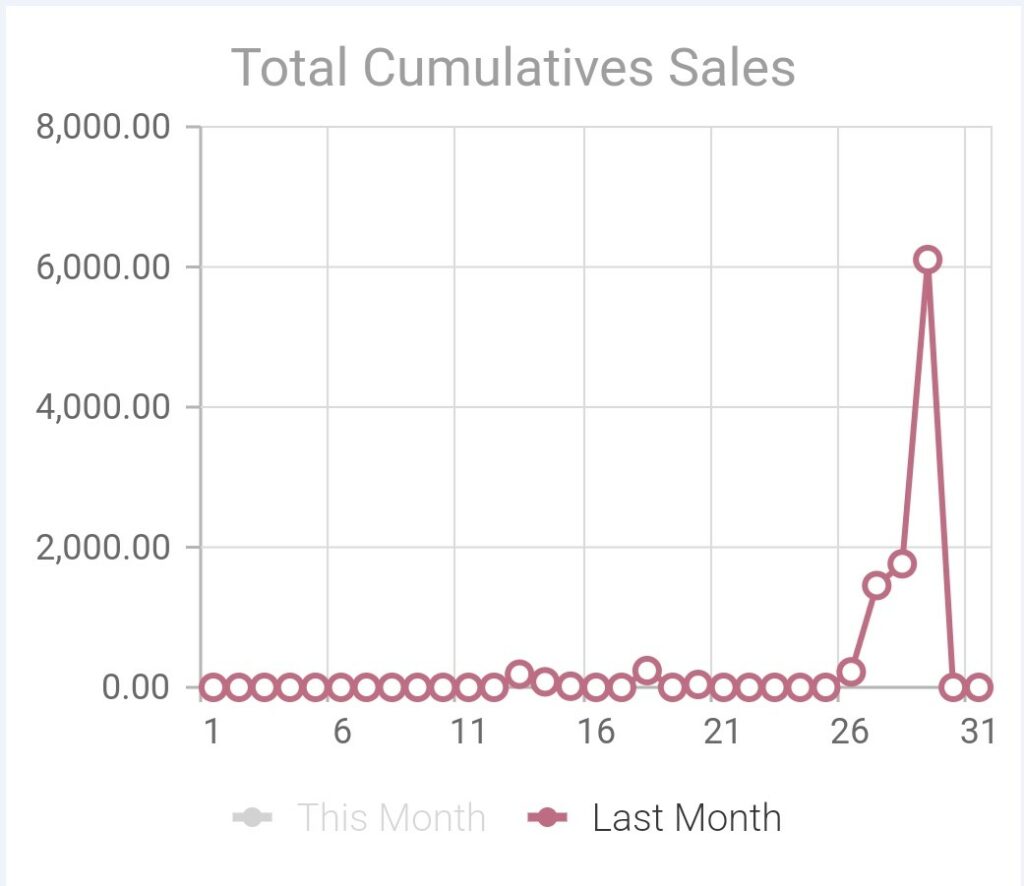
The second graph illustrates the total cumulative sales where the total sales of all branches for a cumulative two months are displayed. If you wish to view only this month’s or last month’s cumulative sales, the other one can be toggled off by tapping “This Month” or “Last Month”.
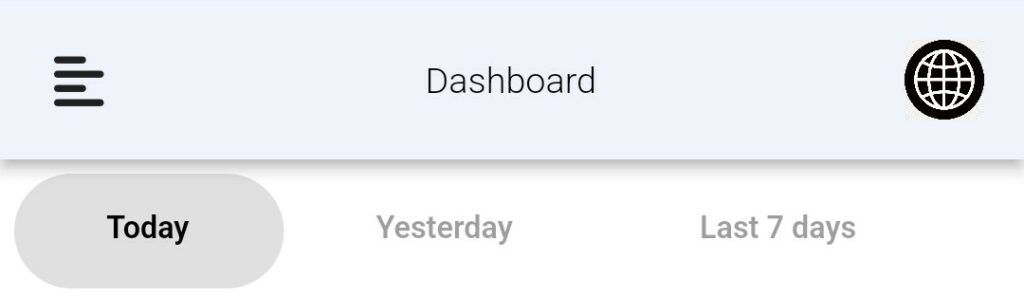
The data of the report within a certain time range can be chosen from the top of the dashboard. A few choices of time range have been listed in the dashboard which are:
- Today
- Yesterday
- Last 7 days
- This Month
- Last Month
Change Language
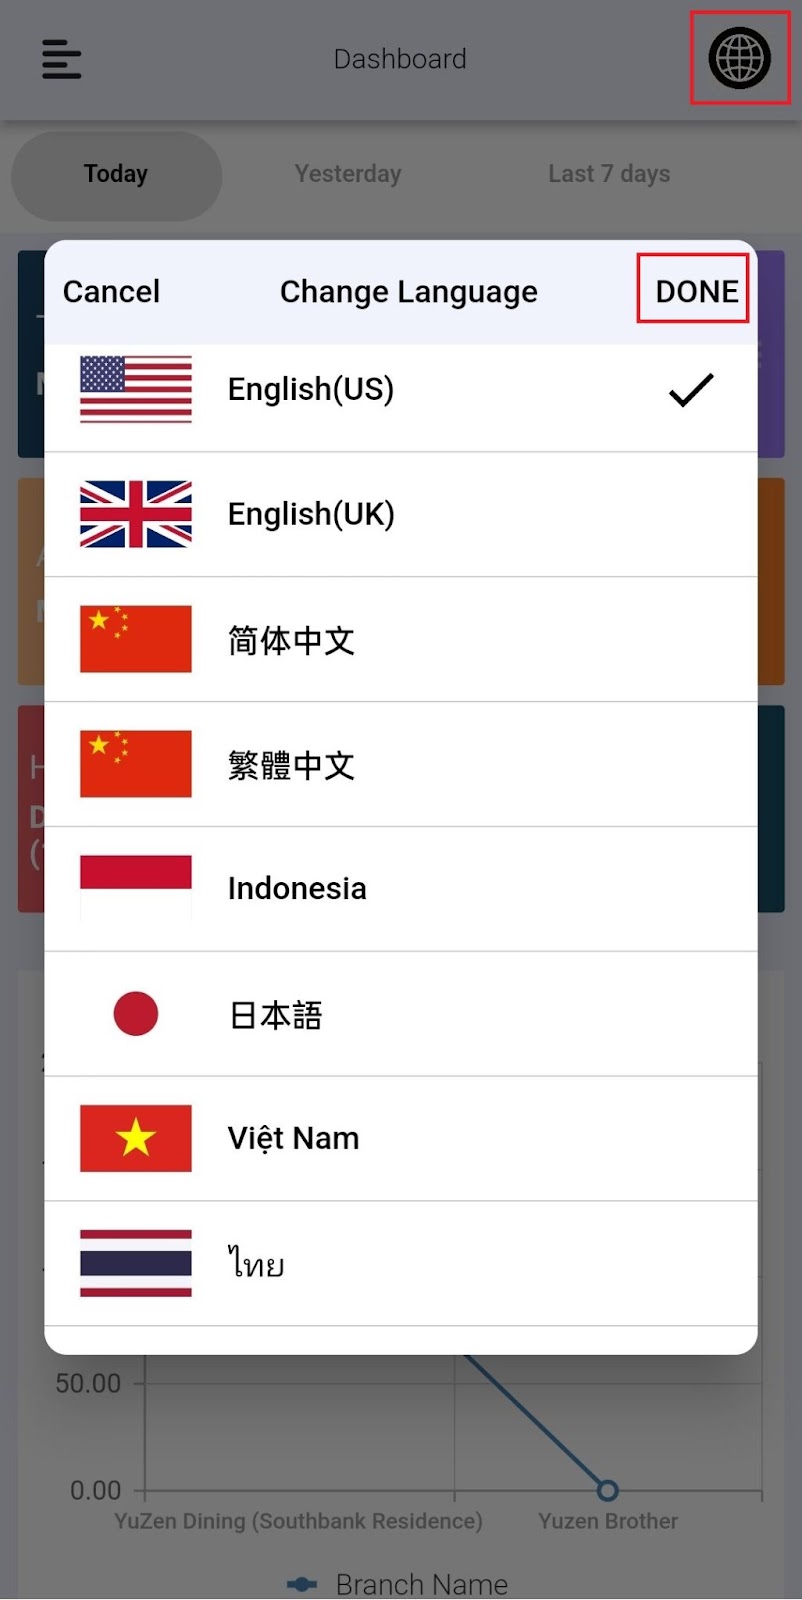
By clicking  on the top right of the dashboard, the application’s display language will be changed. In the application, there are a few choices of languages that can be chosen by the user which are:
- English (US)
- English (UK)
- Simplified Chinese
- Traditional Chinese
- Indonesia
- Japanese
- Vietnam
- Thailand
- Nepali
- Arab
- Urdu
- Bahasa Melayu
After choosing your preferred language, click on ‘DONE’. The application’s display language changed to the language you chose.
Side Menu
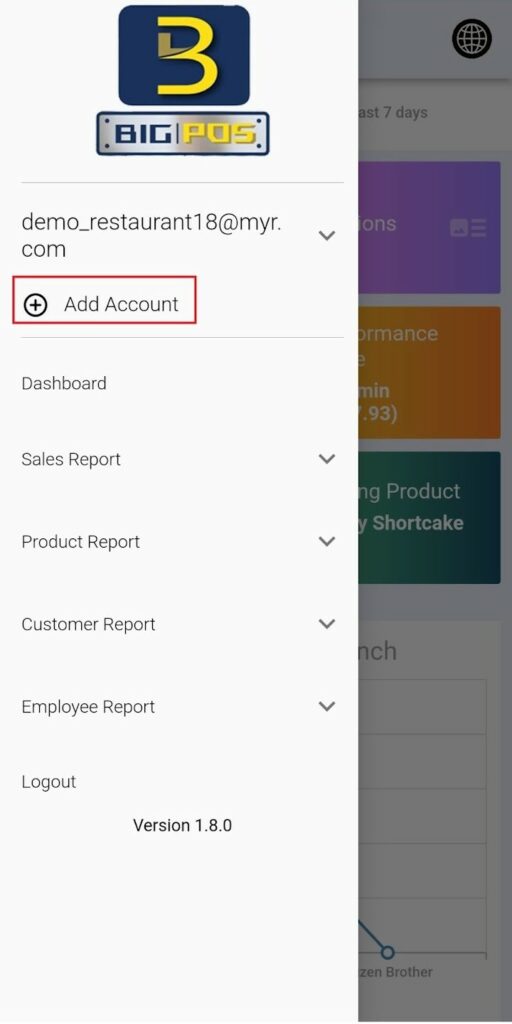
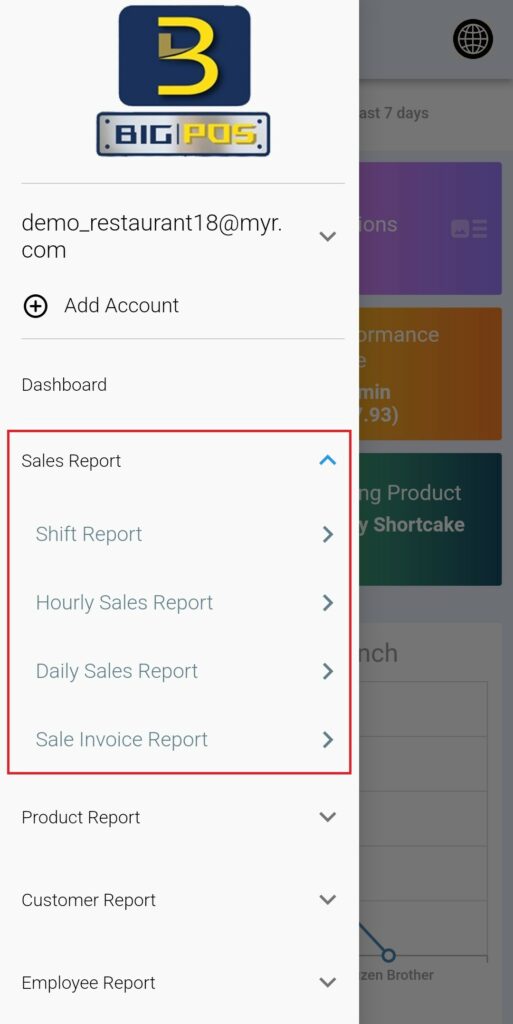
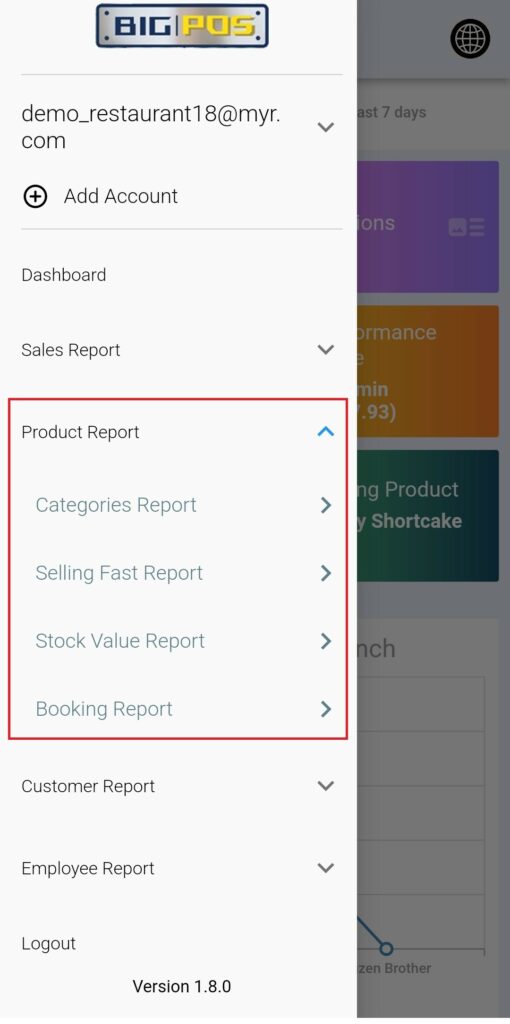
The side menu can be opened by clicking on the ![]() on the top left of the dashboard. The side menu shows the username of the account. You can add more accounts by clicking ‘Add Account’ in the side menu. The application will direct you to the login page to enter the credentials of another account. The side menu also allows you to prospect for various available reports such as sales, product, customer, and employee reports.
on the top left of the dashboard. The side menu shows the username of the account. You can add more accounts by clicking ‘Add Account’ in the side menu. The application will direct you to the login page to enter the credentials of another account. The side menu also allows you to prospect for various available reports such as sales, product, customer, and employee reports.
You may log out from your account by clicking on ‘Logout’. A confirmation message will pop out. By clicking on ‘Yes’, you are successfully logged out from your account whereas clicking on ‘No’ will stay in the dashboard.
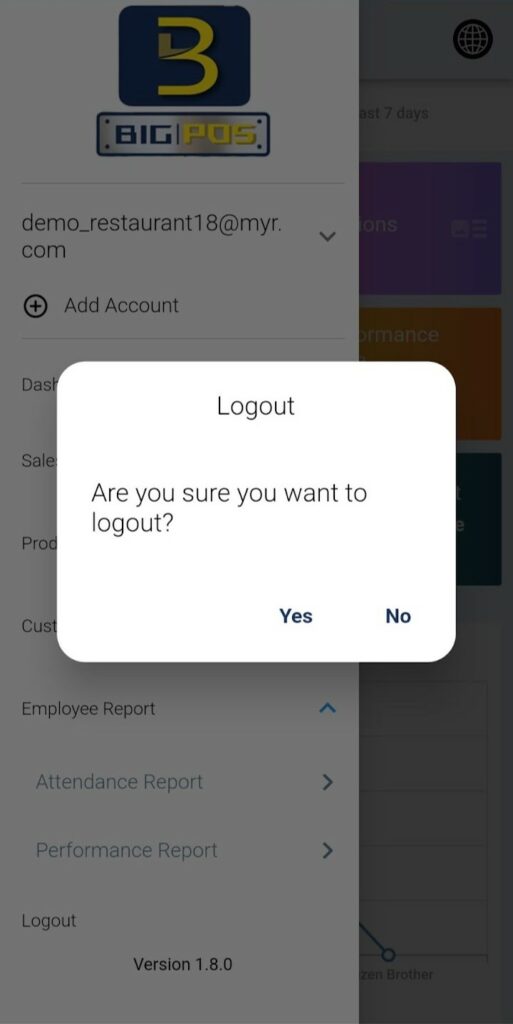
After you log out from your account, the application will prompt you to the login page again. The previous account will be saved in the application. You can choose to log in again by tapping on the username. The application will ask you to enter the password or you can log in by biometrics authentication. You can also log into another account by entering the credentials of another account on the login page.
Sales Report
Under the Sales Report section, BiG Analytics provides a range of reports designed to offer detailed insights into business performance. These include the Shift Report, Hourly Sales Report, Daily Sales Report, and Sale Invoice Report. Each report serves a unique purpose to help users make data-driven decisions.
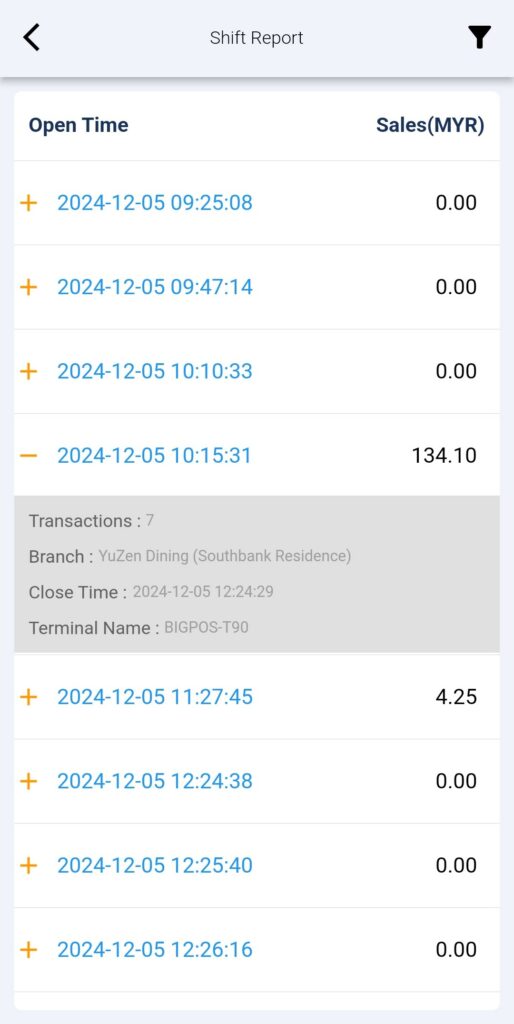
Shift Report
The Shift Report provides a detailed breakdown of sales and transaction data for specific operational shifts. This report includes the following key elements:
- Open Time: Displays the exact start time of each shift, helping businesses track when operations began.
- Sales (MYR): Summarizes the total sales generated during each shift, recorded in Malaysian Ringgit (MYR). Shifts with no sales are marked as “0.00,” while shifts with sales display the corresponding revenue amount.
- Transaction Details: Provides the total number of transactions processed within the shift, offering insights into customer activity levels.
- Branch and Terminal Information: Identifies the branch location and terminal used, ensuring accountability and enabling businesses to trace operations to specific locations and devices.
- Close Time: Indicates the end time of the shift, which is useful for auditing and understanding shift durations.
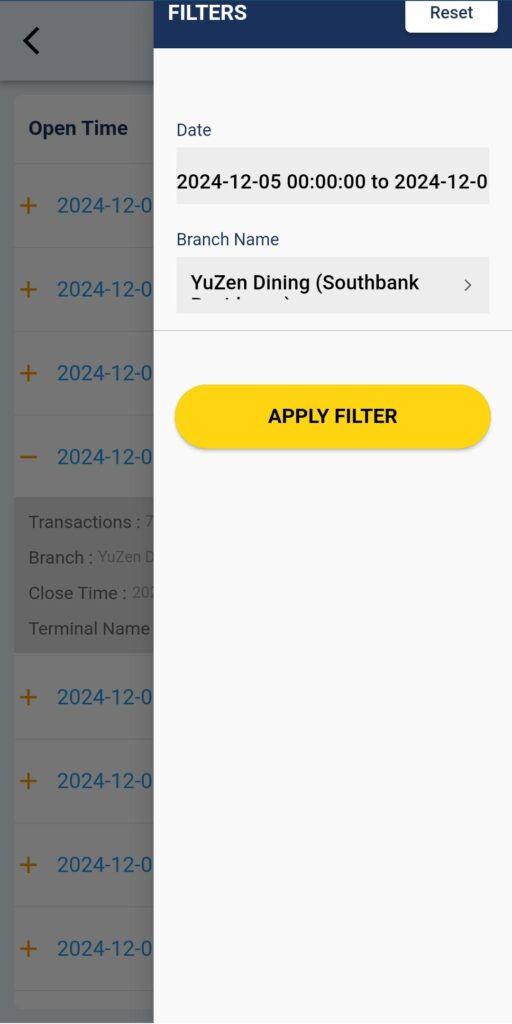
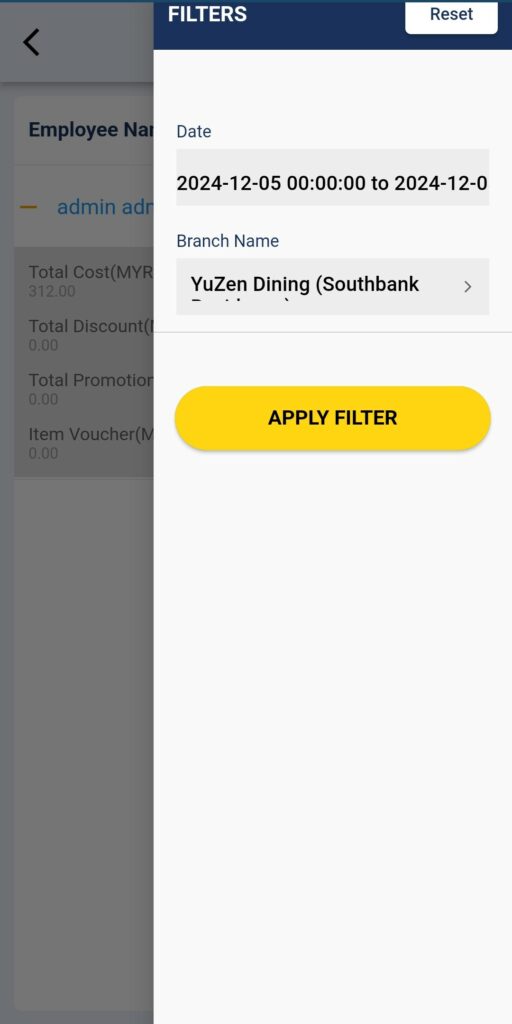
The Filter feature![]() in the Shift Report section allows users to customize the displayed data based on specific criteria, ensuring quick and relevant insights. The available filter options include:
in the Shift Report section allows users to customize the displayed data based on specific criteria, ensuring quick and relevant insights. The available filter options include:
- Date: You can set a specific date range to view shifts and sales records within that period. This is particularly useful for analysing performance trends over a specific time frame.
- Branch Name: This option lets users filter reports by the branch, ensuring they can focus on sales and shift data from a particular location.
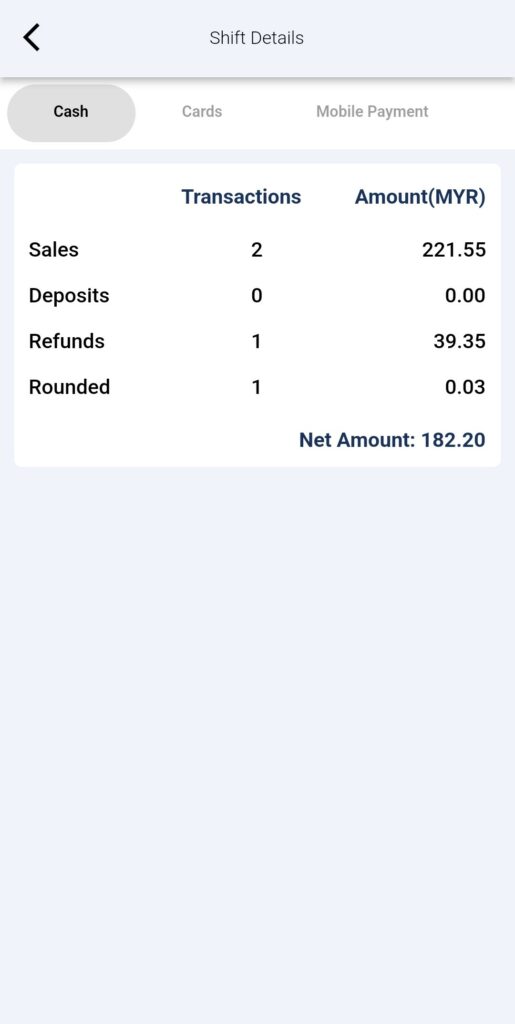
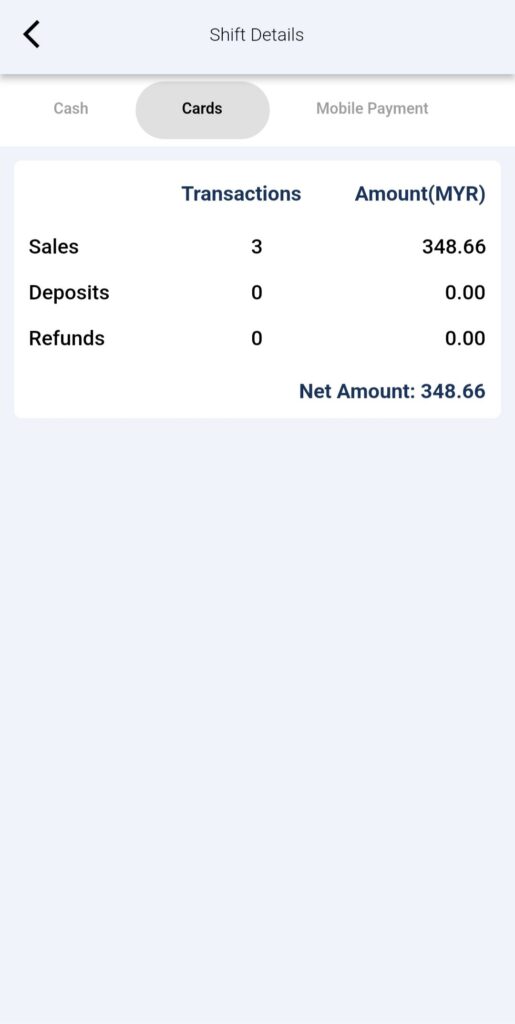
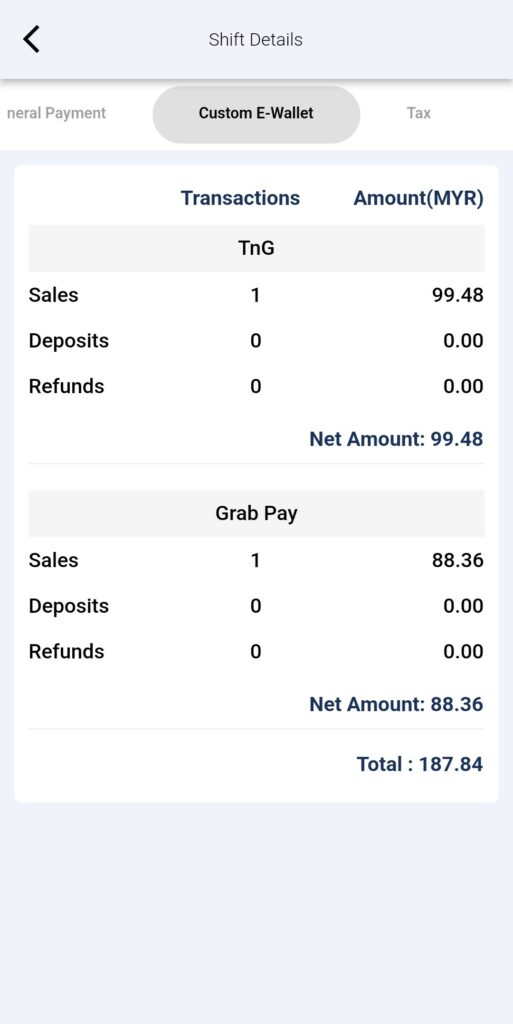
The Shift Report Details can be viewed by tapping the shift in the shift report list. The shift details displayed in the application are:
- Cash
- Cards
- Mobile Payment
- General Payment
- Custom E-Wallet
- Tax
- Cash Drawer
- Pay In/Pay Out
- Transactions
- Cancel / Discount
- Service Charge
- Voucher
- Surcharge
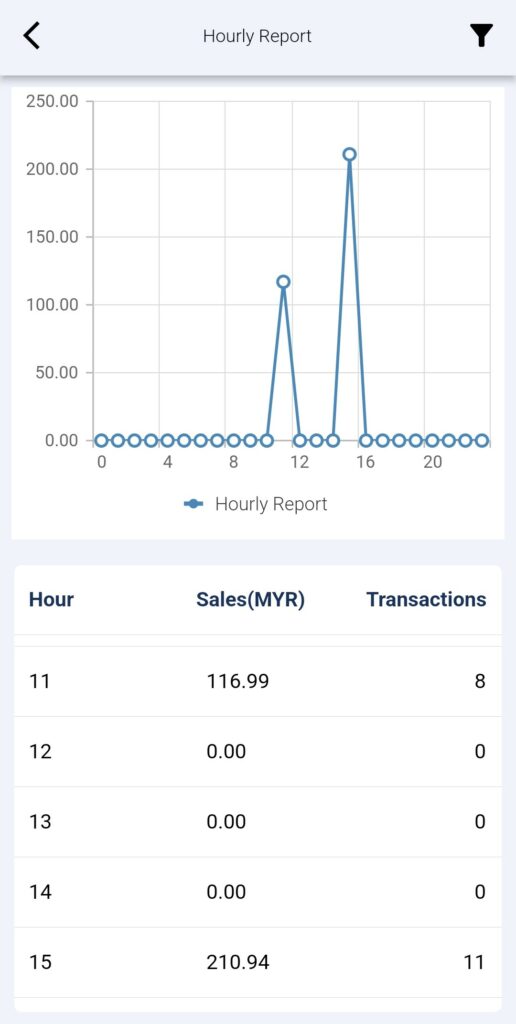
Hourly Sales Report
The Hourly Sales Report offers a breakdown of sales on an hourly basis. The hourly sales data is plotted into a line graph to illustrate the sales trend of the day. The amount of sales and number of transactions every hour are recorded in this report to let the business owner have a better understanding of the business’s peak hour.
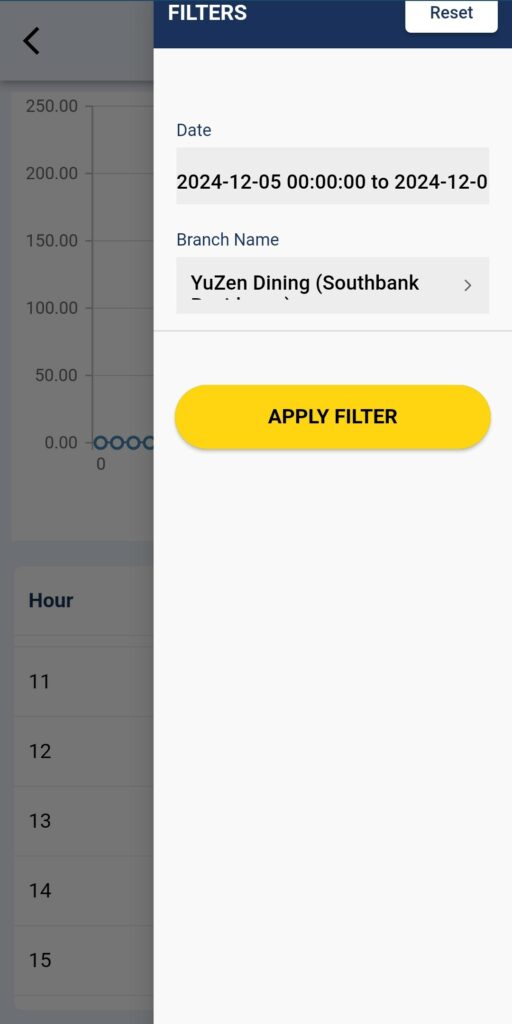
The Filter feature in the Hourly Sales Report section allows users to customise the displayed data based on specific criteria, ensuring quick and relevant insights. The available filter options include:
- Date: You can set a specific date to view hourly sales records within that day.
- Branch Name: This option lets users filter reports by branch, ensuring they can focus on hourly sales data from a particular branch.
Daily Sales Report
The Daily Sales Report provides a comprehensive overview of total sales made within a single day. It helps businesses track daily revenue, compare performance across days, and assess the impact of daily promotions or events. The details of the Daily Sales Report are as follows: –
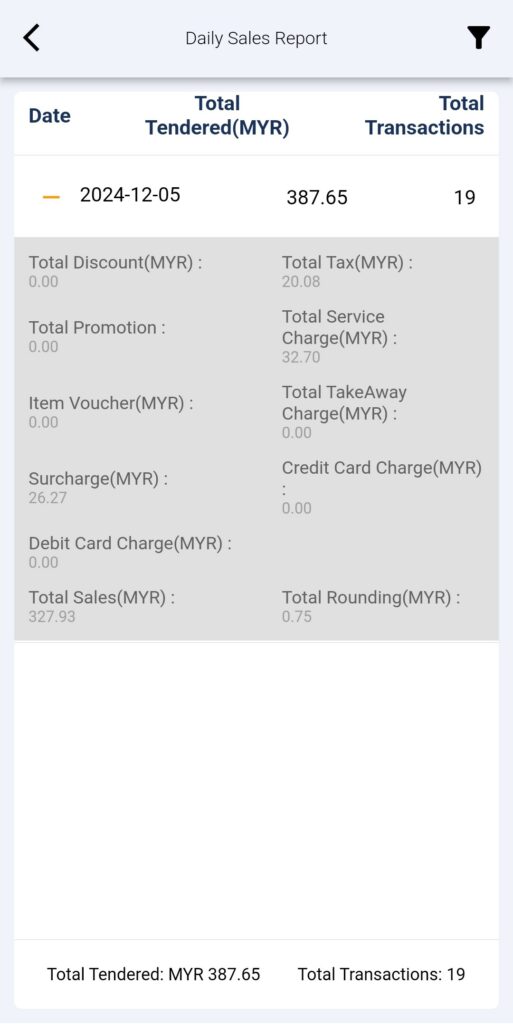
The Filter feature in the Daily Sales Report section allows users to customize the displayed data based on specific criteria, ensuring quick and relevant insights. The available filter options include:
- Date: You can set a specific date range to view daily sales records within that period. This is particularly useful for analysing performance trends over a specific time frame.
- Branch Name: This option lets users filter reports by branch, ensuring they can focus on daily sales data from a particular branch.
On the dashboard, the ‘Today/Total Tendered’ and ‘Today/Total Transactions’ blocks are clickable to view the details of the Daily Sales Report for the time range chosen. The ‘Average Sales’ is the quotient of the tendered amount divided by the amount of transactions.
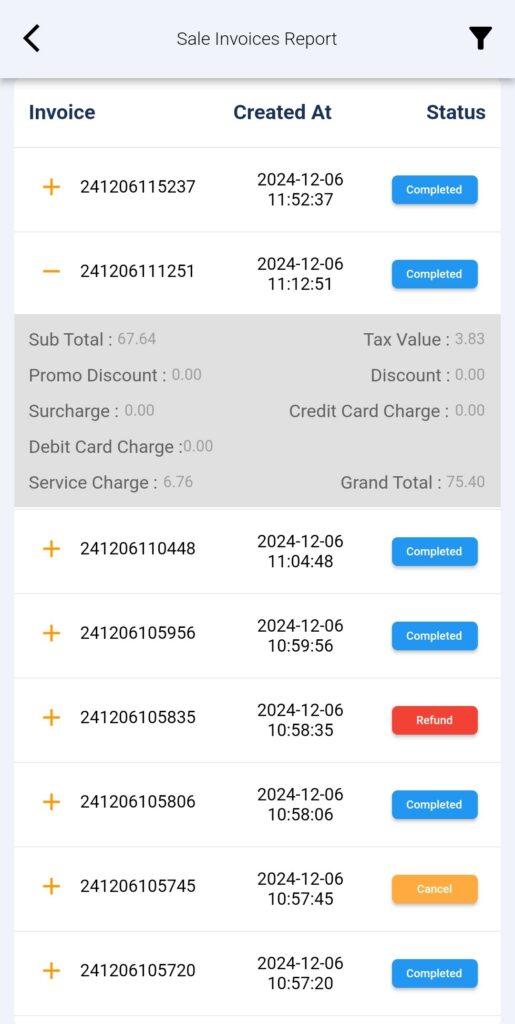
Sales Invoice Report
The Sales Invoice Report is particularly useful for auditing, customer service inquiries, and ensuring accurate record-keeping. It will show the invoice ID, created date, status and also billing details of each transaction.
The Filter feature in the Sales Invoice Report section allows users to customise the displayed data based on specific criteria, ensuring quick and relevant insights. The available filter options include:
- Date: You can set a specific date range to view invoice records within that period. This is particularly useful for analysing performance trends over a specific time frame.
- Branch Name: This option lets users filter transactions by branch, ensuring they can focus on sales invoice data from a particular branch.
- Invoice ID: You can filter the sales invoice by entering the invoice ID. This will minimise the time of searching that invoice out of the transactions list.
- Status: This can filter the transactions with the matching status such as “Completed”, “Refund”, “Cancel” and so on.
Product Report
Under the Product Report section, BiG Analytics delivers comprehensive tools to analyse and optimise product performance. This feature includes reports like the Categories Report, Selling Fast Report, Stock Value Report, and Booking Report, each designed to help businesses gain actionable insights into their product inventory and sales trends.
Categories Report
The Categories Report provides an overview of product performance across different categories, enabling businesses to identify strengths and gaps. This report lists the total sold of each category and the hot category is always listed at the top of the list followed by other category. BiG Analytics transforms the category list into a visually engaging pie chart to help users effortlessly understand and interpret data on the best-performing and hot-selling categories. The ‘Hot Category’ on the dashboard shows the top-sold category and it can access the Category Report by simply clicking on it.
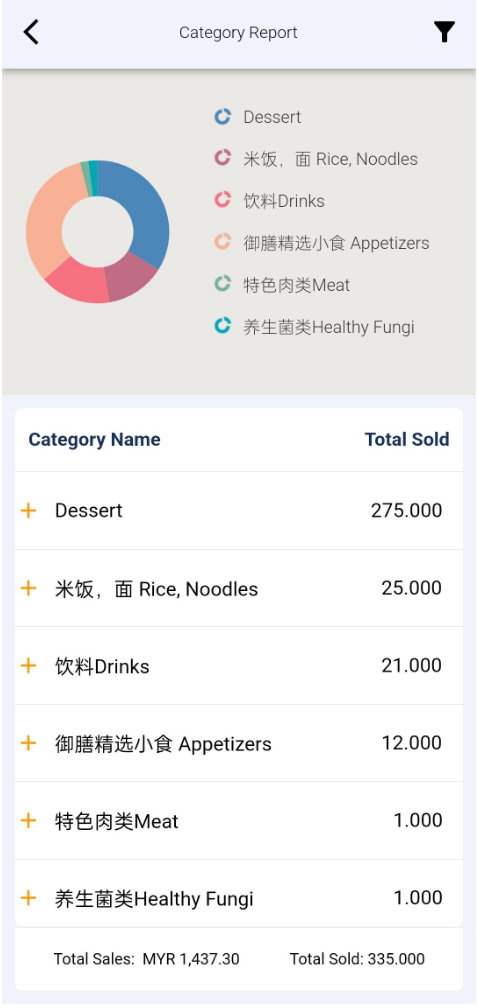
The Filter feature in the Categories Report section allows users to customise the displayed data based on specific criteria, ensuring quick and relevant insights. The available filter options include:
- Date: You can set a specific date range to view the number of category products sold within that period. This is particularly useful for analysing performance trends over a specific time frame.
- Branch Name: This option lets users filter transactions by branch, ensuring they can focus on the number of category products sold from a particular branch.
Selling Fast Report
The Selling Fast Report highlights the hot-selling product of the business and lists the number of products sold. In this report, BiG Analytics provides chart data about the number of products sold and ranks the hot-selling products on the top. By tapping the product’s bar, the number of products sold is displayed. This report can also accessed from the dashboard by clicking on the ‘Best Selling Product’ where the best-selling product will be displayed in the dashboard.
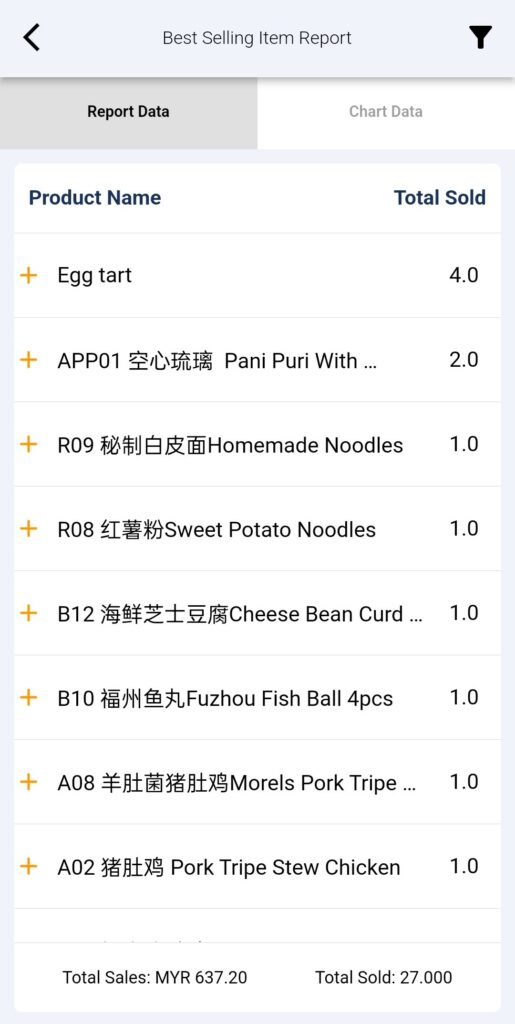
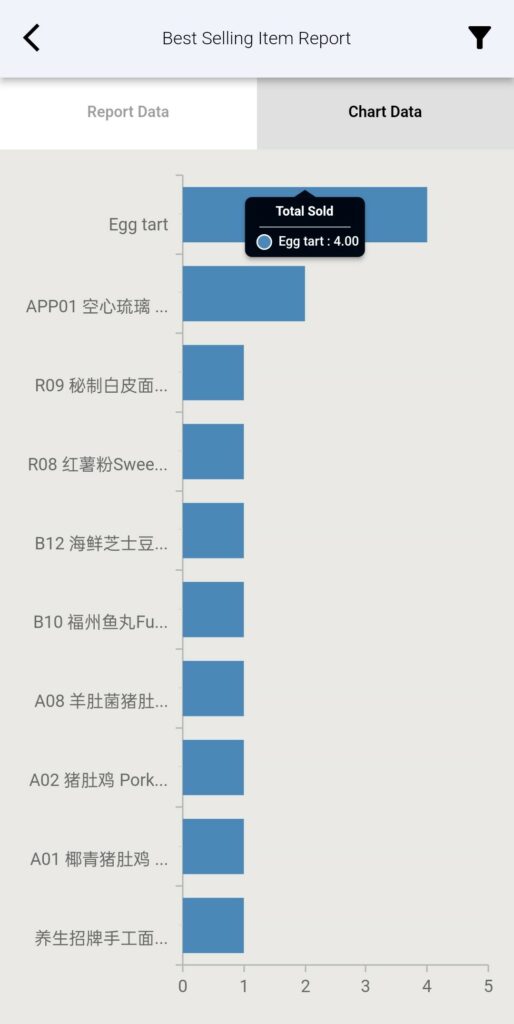
The Filter feature in the Selling Fast Report section allows users to customise the displayed data based on specific criteria, ensuring quick and relevant insights. The available filter options include:
- Date: You can set a specific date range to view the number of products sold within that period. This is particularly useful for analysing performance trends over a specific time frame.
- Branch Name: This option lets users filter transactions by branch, ensuring they can focus on the number of products sold from a particular branch.
Stock Value Report
The Stock Value Report gives a detailed assessment of inventory valuation, helping manage stock levels effectively. The report displays the total quantity of products and lists the products that have higher stock levels first. The details of the products can be expanded by clicking on the “+” beside the product name.
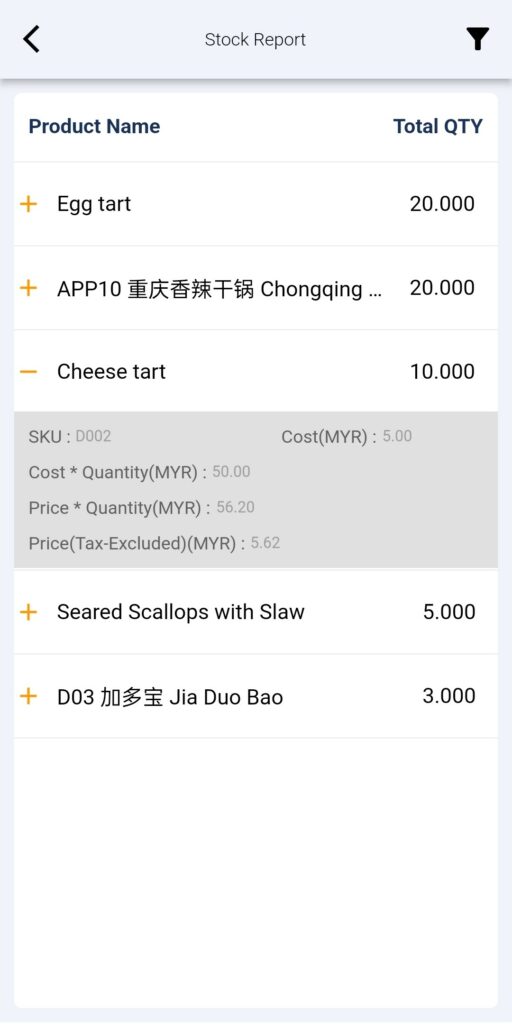
The Filter feature in the Stock Value Report section allows users to customise the displayed data based on specific criteria, ensuring quick and relevant insights. The available filter options include:
- Branch Name: This option lets users filter stock levels by branch, ensuring they can focus on the stock levels from a particular branch.
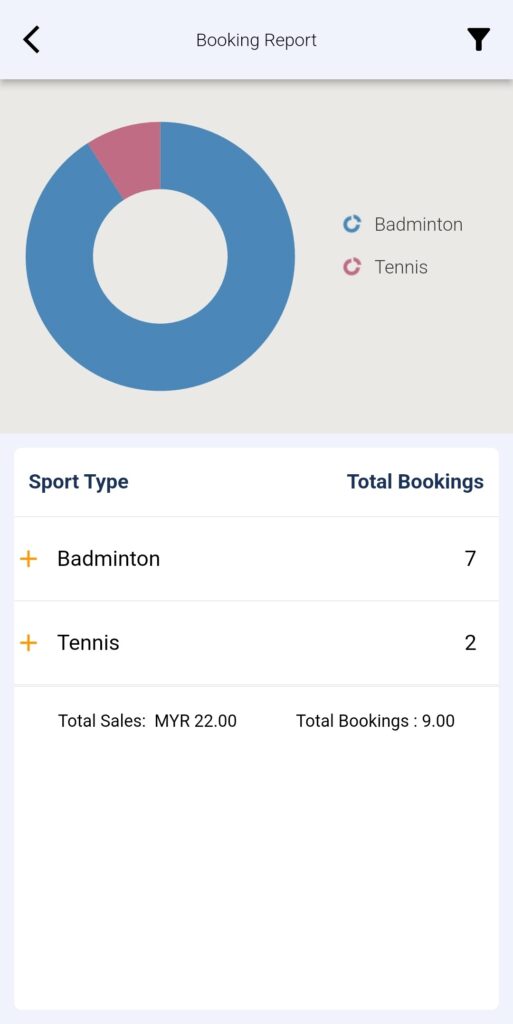
Booking Report
The Booking Report is only available for sports-related accounts. This feature report is currently not available for F&B business owners to display. The Booking Report provides a visual breakdown and detailed overview of sports bookings, showing the total bookings of the sport and a visualised pie-chart indicating the portion of total bookings. The total sales of that sport can be viewed from the expandable “+” button. The booking report can be filtered according to the date range and the branch name.
Customer Report
Under the Customer Report section, BiG Analytics offers valuable tools designed to help businesses better understand their customer base and improve engagement strategies. This section includes reports such as the Customer Report and Loyalty Report, each providing unique insights to support customer-focused decision-making.
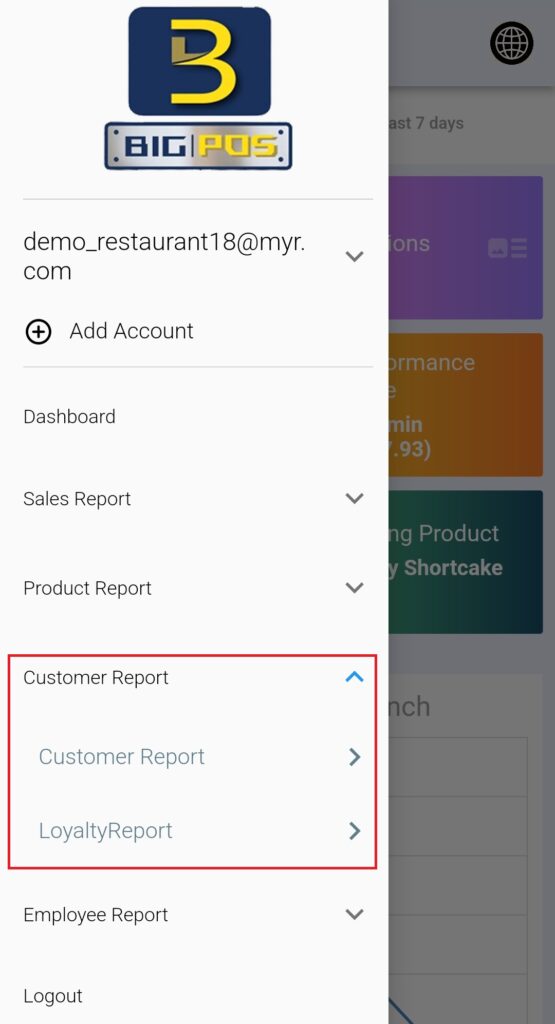
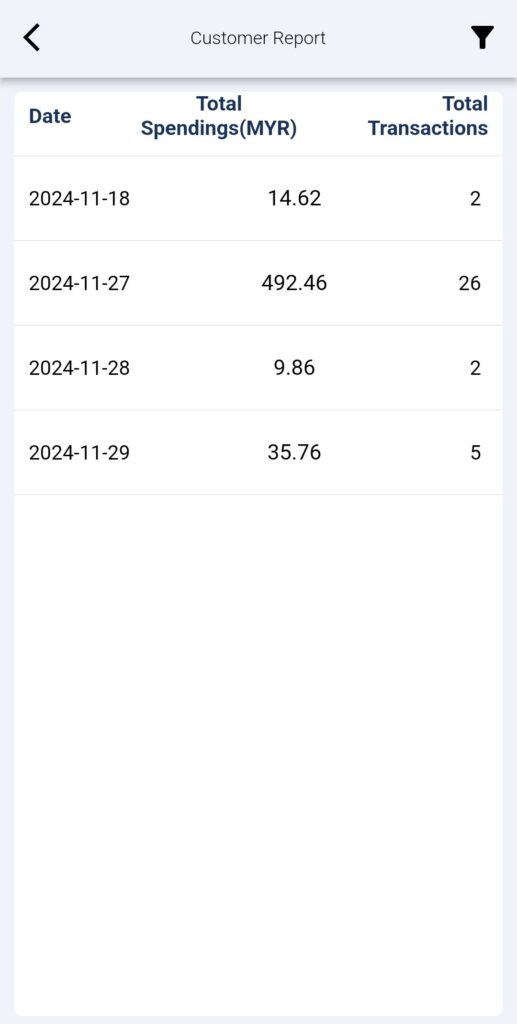
Customer Report
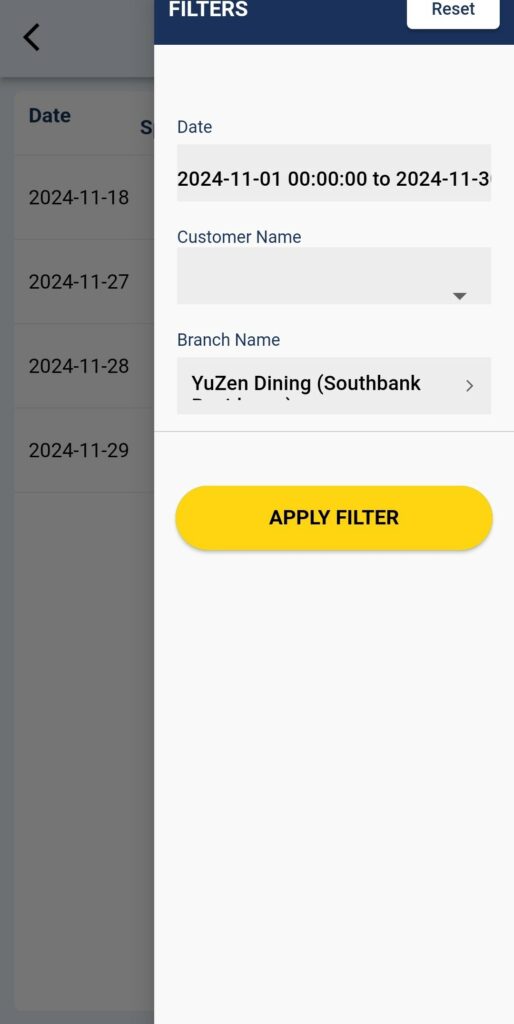
The Customer Report reports the transactions by the registered customer. If the customer is added to the cart and makes a transaction, the details will be recorded and displayed in this customer report. To view the customer report, you must filter the customer name, the time range and the branch to get an accurate result.
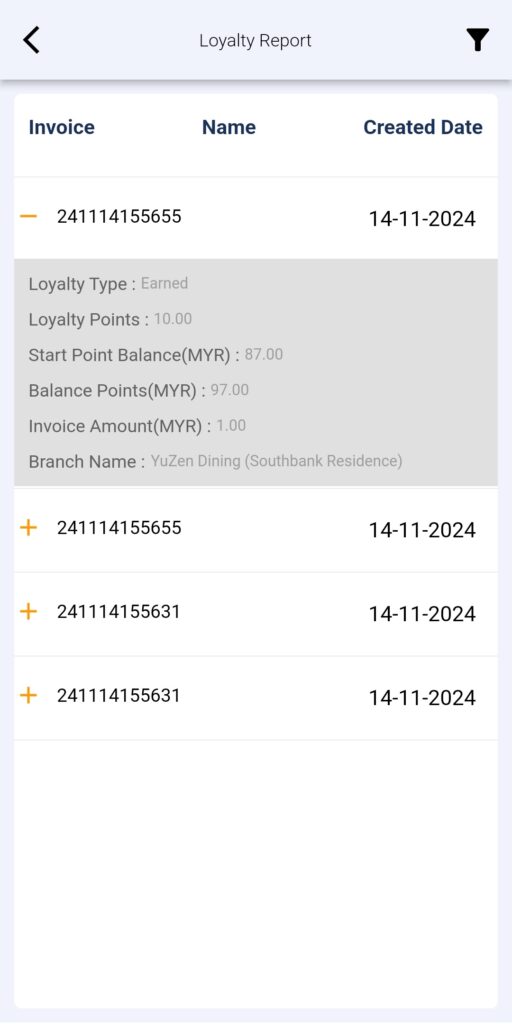
Loyalty Report
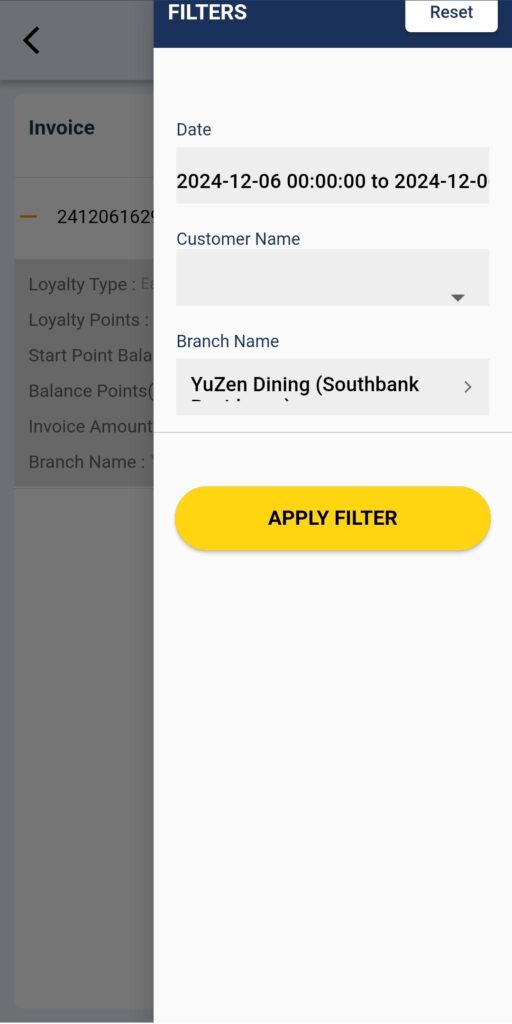
The Loyalty Report focuses on tracking customer loyalty metrics, such as repeat purchases and redemption of loyalty rewards. To display a customer’s loyalty report, you must enter the filter first so that an accurate result will be displayed. The key element of the filter is the Date, Customer Name and Branch Name.
In the report, each transaction that collected or used the loyalty points will be recorded and displayed. Click on the “+” to expand the loyalty points details. The details will record the:
- Loyalty Type:
- Earned: Customer earned loyalty points by placing an order.
- Deduct: When the customer refunds or cancels an order at that time deduct points from the customer which are earned from that order.
- Loyalty Points
- Start Point Balance
- Balance Points
- Invoice Amount
- Branch Name
Employee Report
Under the Employee Report section, BiG Analytics equips businesses with tools to monitor and enhance workforce performance effectively. This section includes the Attendance Report and Performance Report, both tailored to provide critical insights into employee productivity and work habits.
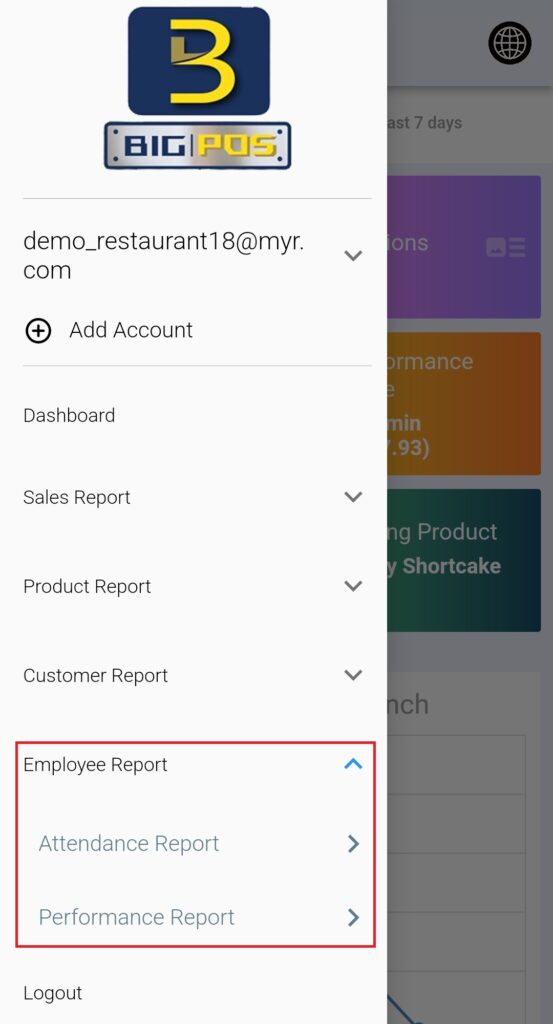
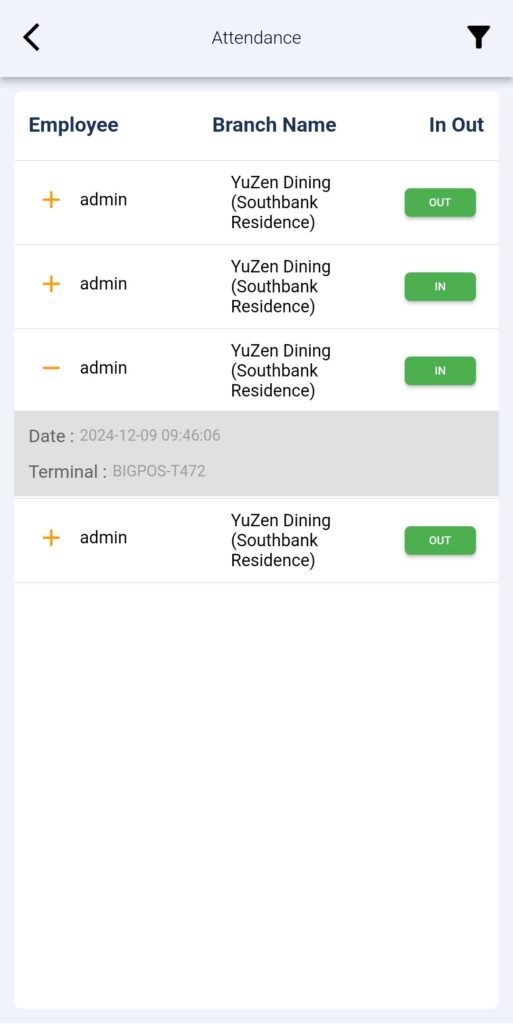
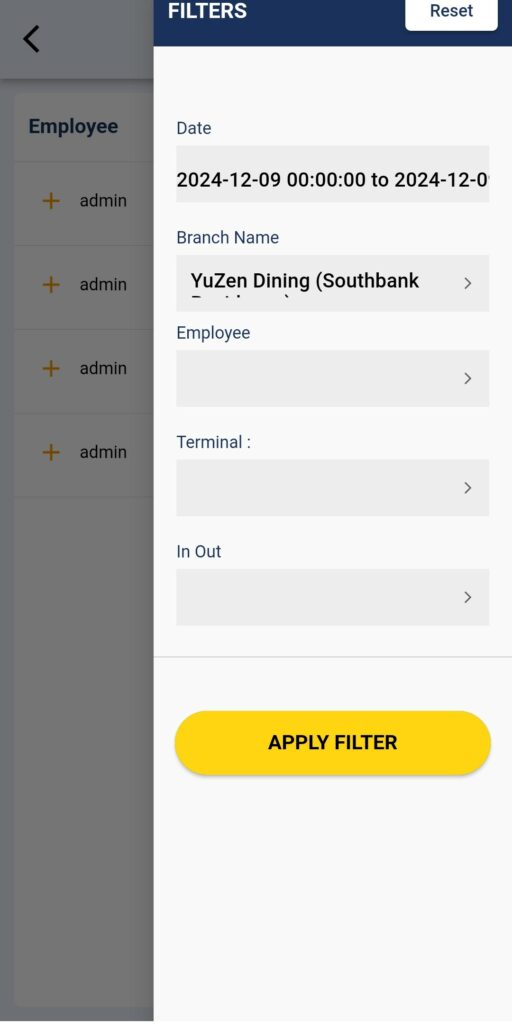
Attendance Report
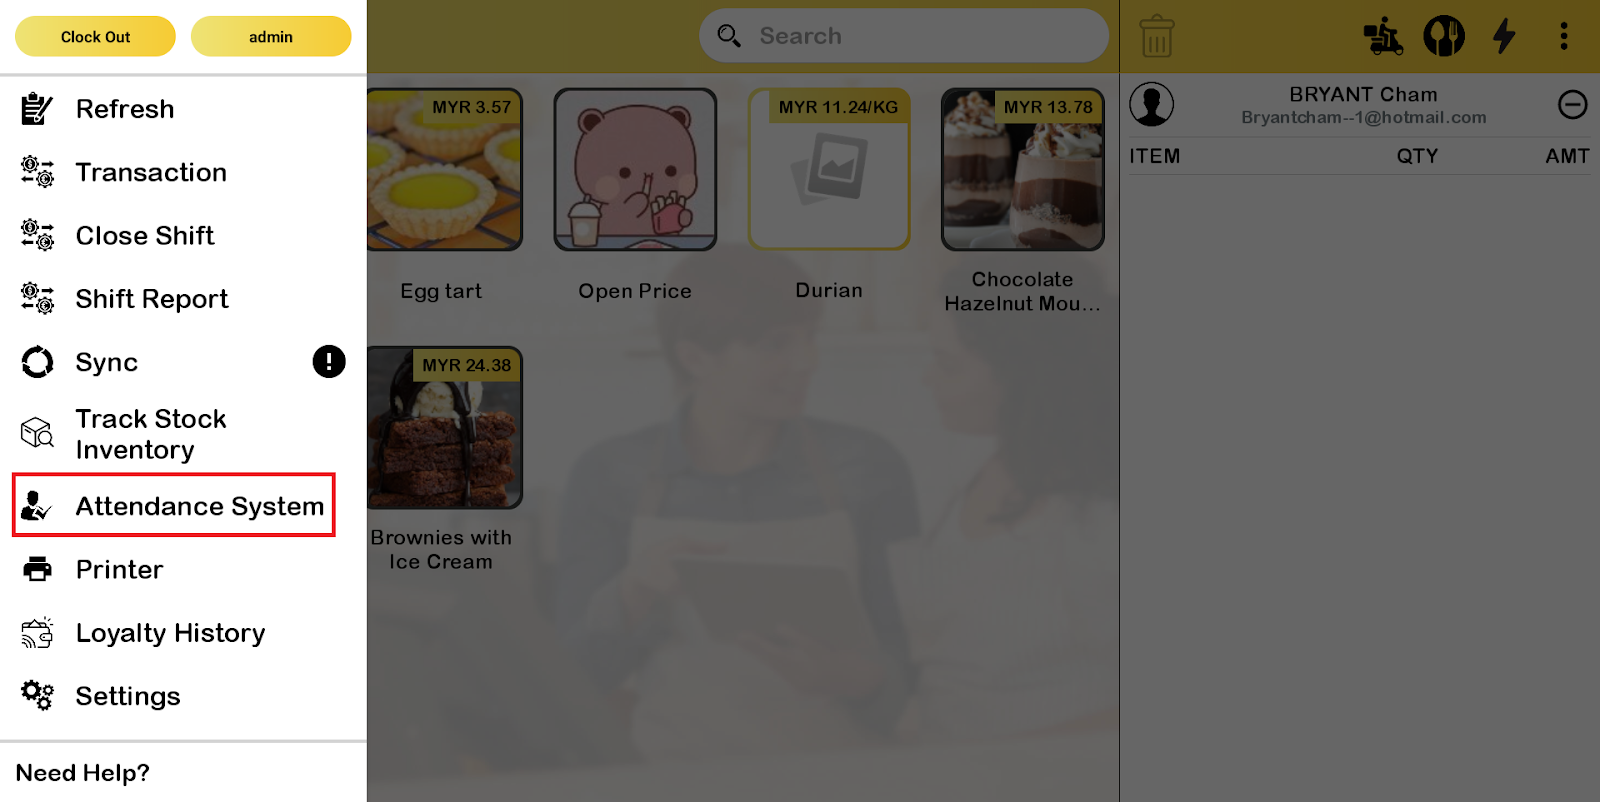
The Attendance Report tracks employee presence, punctuality, and absences, enabling managers to identify trends and ensure adherence to work schedules. The attendance report is syncing with the “Attendance System” in the BIGPOS Pro or Lite app. The employee needs to enter their PIN every time clock in and out.
To check on the employee attendance report, you must enter the filter to get an accurate result including the Date, Branch Name, Employee Name, Terminal Name and In-Out status.
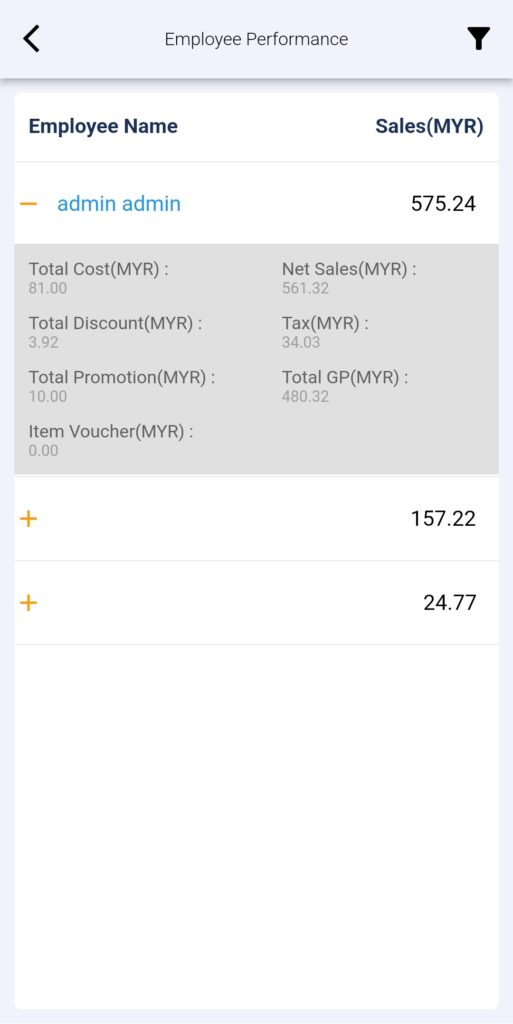
Performance Report
The Performance Report evaluates key metrics related to individual and team contributions, offering data to assess productivity, recognize top performers, and pinpoint areas for improvement.
The performance report recorded the total sales produced by each employee. With the expand button “+”, the details will be displayed such as:
- Total Cost
- Total Discount
- Total Promotion
- Item Voucher
- Net Sales
- Tax
- Total GP
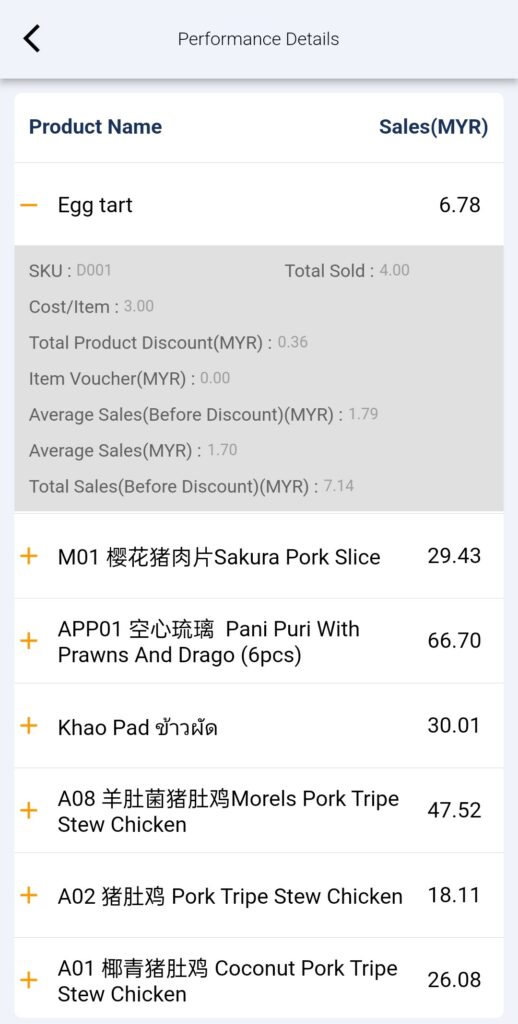
By clicking the name of the employee, the product sold and the corresponding sales figures will be displayed. These performance details enable managers to assess individual contributions, recognize high-performing employees, and identify areas where additional support or training may be needed.
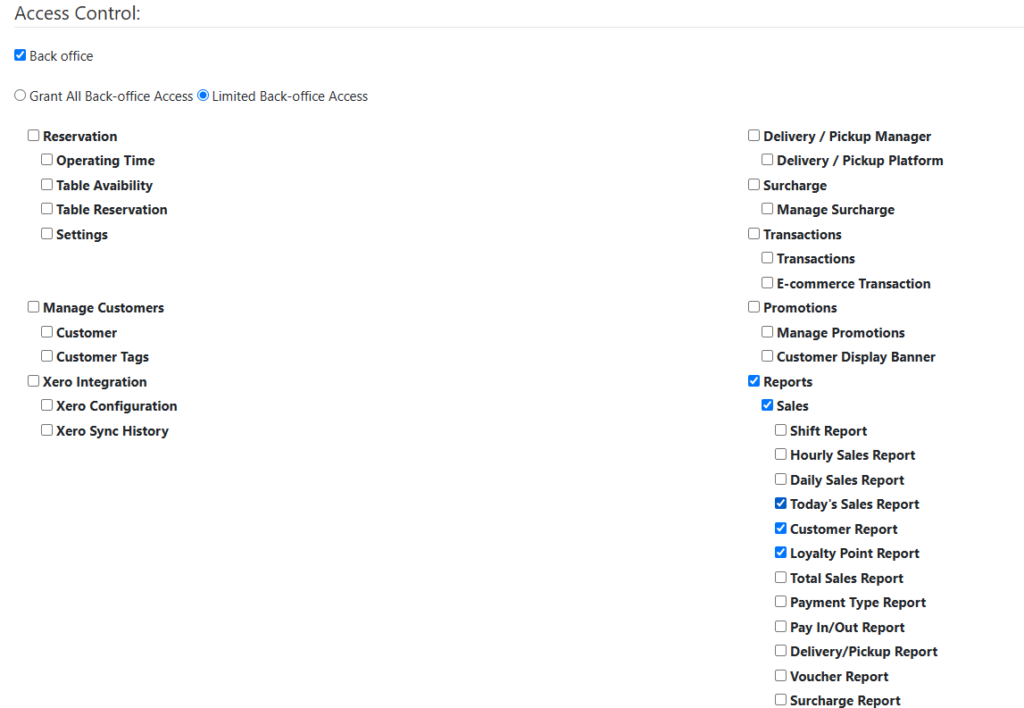
Report Access Limitation of Employee
The employee’s access to the reports on the above can be limited in Web Admin settings. The limitation can be set under the Employees section. You can choose which reports can be accessed by the employee and save the changes. Employees are able to access reports in Big Analytics following web admin access.